Tech Talk: Wave-tracking data helps surfers gain an edge in the water
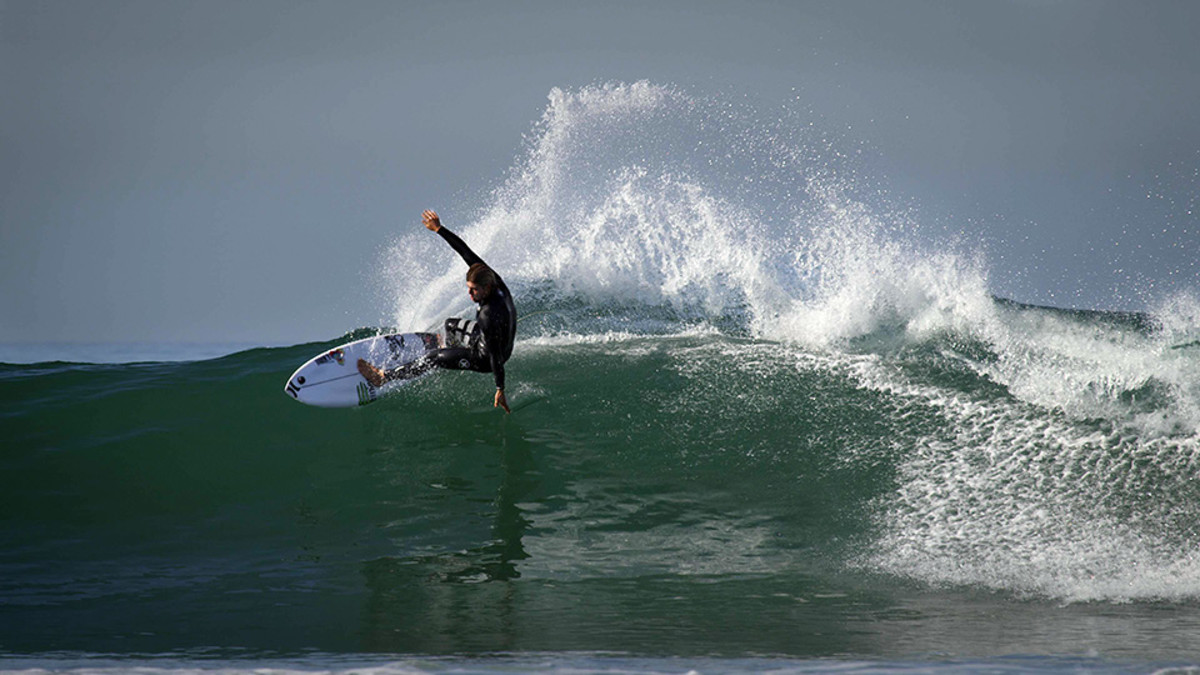
Trace now knows more about the break of Lower Trestles in San Diego County than ever before. The action sports tracker ran a spot check at the Oakley Lowers Pro surf event by collecting six months of surfing data to depict wave patterns and performance trends leading into the spring competition.
What did Trace do?
Trace—as explained in this previous Tech Talk column—uses its Reese’s Peanut Butter Cup-sized device to attach to a surfboard to record surfing metrics, such as waves, wave count, speed, length of ride, number of turns, turns in degree, paddle distance and air time. By teaming up with Oakley surfer Conner Coffin, Trace recorded rides of the Southern Californian surfer and overlaid his “heat map” on top of the break at Lowers, showing where surfers could gain the most speed and perform the most maneuvers.
Krossover's game film solution keeps coaches out of the editing booth
Trace data showed that the right side at Lowers produced a longer wave with higher speed and more maneuvers, while the left side equated to more vertical surfing with faster cutbacks and smaller turn angles.
How Coffin used the data
“I didn’t go out thinking I’ll try to surf differently to get feedback, my role was to go surf,” Coffin tells SI.com. “It is cool to see where you accelerate on a wave, the different places you get speed and different turns where you get speed.”
The surfer says he was intrigued to find different types of turns cost him speed, which will help him in the future to watch how hard he turns. Having the data breakdowns after a ride, he says, helped raise awareness of how to get faster and turn harder more efficiently.
What else is the data good for?
Coffin’s surf metrics were about more than understanding Lower Trestles. He also plans to use Trace in conjunction with his board maker—Channel Island Surfboards by Al Merrick—to test how different materials handle the waves.
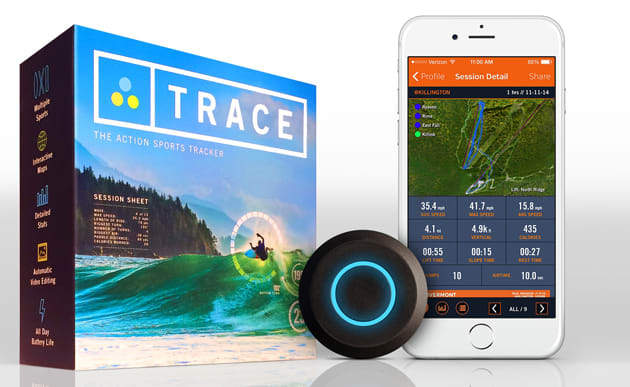
Courtesy of Trace
“We are making some new boards,” he says. “Trace can help measure the way the boards ride and flex with materials. You could have four or five different boards and this one could go 20 miles per hour in this part and [another] board 25.”
With data, he can back up on-board experiences to select the right combination of materials.
The future of data
We’ve seen data-based decisions take a massive rise in team sports already. Action sports may prove to be the next wave.
“Surfing is very hard to quantify. It is very uncapped,” Coffin says. “To have something like this, telling me I rode my wave from here to there and then breaking down degree of turns and specific speeds within those turns could be used in a good way.”
We now know more about Lowers. Coffin hopes to soon know more about how board materials react in exact wave situations. Soon we’ll all know a lot more about the data behind the sport of surfing.
Tim Newcomb covers stadiums, design and gear for Sports Illustrated. Follow him on Twitter at @tdnewcomb.