Now more than ever, it's three strikes you're out at the old ballgame

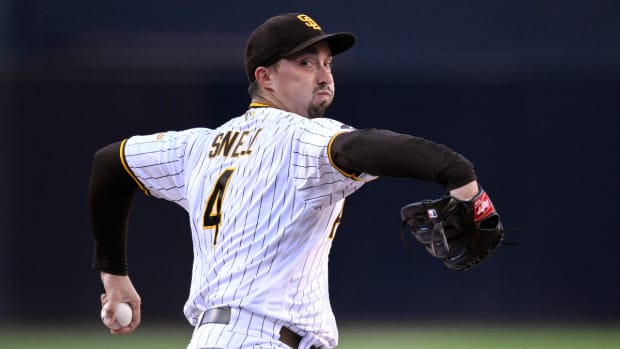
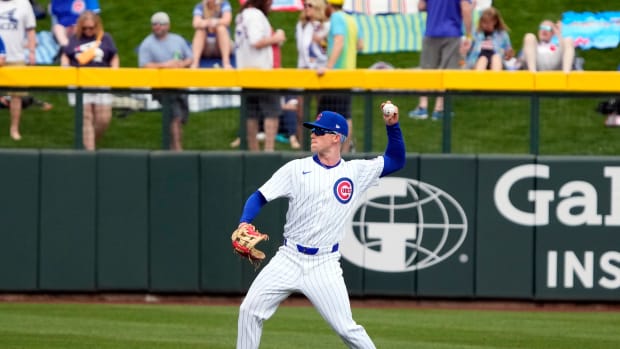
Mets phenom Matt Harvey pitched a one-hitter last week and ranks third in the majors with 62 strikeouts.
Chuck Solomon/SI
Three times in four days last week, a starting pitcher came within one base hit of a perfect nine innings, starting with the Mets' Matt Harvey last Tuesday and then the Red Sox' Jon Lester and CardinalsShelby Miller both on Friday. If not for a ninth-inning error behind him on Sunday night, the White Sox' Chris Sale would have made it four such starts in six days.
There were other no-hitter flirtations, too. The Cardinals' Adam Wainwright didn't allow his first hit until the eighth inning on Saturday, and yielded only two hits and a walk in a complete-game shutout. The Rockies' Jorge de la Rosa didn't give up a hit until the seventh inning on Sunday.
These were but the latest pitching masterpieces in a season already brimming with them, as pitching dominance continues to grow, especially in the past four seasons.
"The offensive game, at times, is really challenged at the major league level," Pirates manager Clint Hurdle said. "The pitching has accelerated."
Trends in baseball used to be realized more gradually, the way of ancient ice ages, but in the last two decades the sport has seen volatile intrusions of its natural habitat.
First, there was the pharmaceutically-enhanced offensive explosion of the late 1990s and early 2000s, and now there's been another rapid alteration of the run-scoring environment, this one a depression of offense as hitters' adaptations to a changing offensive climate have lagged.
Runs are down across baseball yet again, with teams scoring 4.26 runs per game, the lowest rate since 1992. Batting average in the majors is .251, the lowest since 1972. On-base percentage is .318, the lowest since 1988.
Strikeouts are way up, to 7.63 per team per game. That's a half-strikeout more per game than just two years ago, up a full strikeout in six years and up two strikeouts in 21 years, when it was 5.59 in 1992, a 36 percent increase. A rise in two strikeouts per team per game translates to 9,720 more strikeouts per season.
This season the Tigers' pitching staff is striking out 9.92 batters per nine innings, and the Red Sox are striking out 9.64. Both, therefore, are averaging more than a strikeout per inning, which no team has ever sustained for an entire season, unless you want to include the illustrious 1884 Milwaukee Cream Citys [sic] into our sample. Only 19 teams in the Modern Era (starting in 1901) have finished a season with a K/9 of 8.0 or higher, with 11 of them from the last three years. In 2013 there are 11 more teams on pace to join them.
These trends, of course, have been noted and explored before, but their influence only grows stronger and, after the virtuoso starts of last week, we are again left wondering, why?
? An explosion of new technology, data and video has helped pitchers better exploit hitters' weaknesses. Mets pitching coach Dan Warthen estimates he watches an extra four or five hours of video per day than he did a decade ago. "I think we have a better feel for how we want to approach hitters," he said.
While hitters also have access to more data, the benefit is lopsided in favor of pitchers.
"The pitcher is the proactive member in this situation," Rays manager Joe Maddon said. "He gets to throw what pitch he wants wherever he wants in that moment. The hitter is guessing all the time, but the pitcher knows exactly what he wants."
Also, more information about batted ball tendencies of hitters has inspired more managers to implement bolder defensive shifting.
"The data regarding defense -- that's why batting averages have gone down and guys get frustrated defenses are in the right spot all the time," Maddon said. "Even from satellites now, my God. It's much easier for somebody to be in the right spot."
? Fewer hitters employ a more cautious, contact-oriented two-strike approach. Instead, many still try to swing for the fences rather than put the ball in play.
So far this season, hitters are batting .178 with two strikes, slugging one home run every 55.9 at bats and striking out once every 2.51 plate appearances; 25 years ago, the league-wide rate was a .184 average, a 69.5 AB/HR and a 2.89 PA/K rate. That's a 13 percent increase in strikeouts.
"You don't have a lot of guys who really walk up with a definite two-strike approach anymore," Mets manager Terry Collins said. "The power is so dominant now. Everybody's got longer swings. When you're locating, that's where the strikeouts are going to come."
? There's less stigma attached to strikeouts, and teams are more willing to tolerate them.
Free agency is baseball's version of natural selection, and hitters like Mark Reynolds and Carlos Peña, who hit home runs even at the expense of huge strikeout totals, continue to get jobs.
The Braves are a great case study. Players who hit a lot of home runs and strike out a lot aren't just accepted, but they appear to be part of a central team-building strategy. Atlanta's hitters lead the NL in home runs and strikeouts this year. And they are unashamed of how they generate their offense, with the league's highest percentage of their runs scored via the home run.
"Teams that don't strike out are probably complaining they don't have any power in the lineup," Atlanta manager Fredi Gonzalez said.
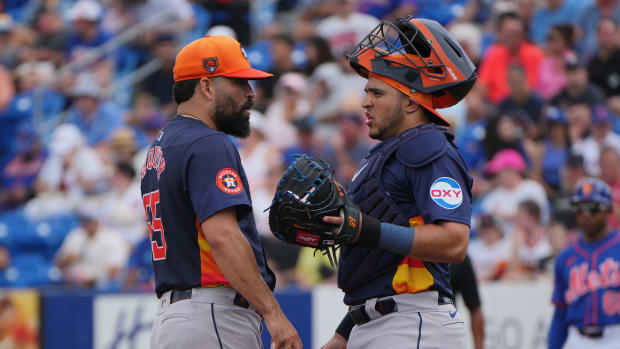
? The specialization of bullpens has improved their effectiveness. Clubs are matching up relievers left-on-left or right-on-right against hitters more frequently, and more teams are spending bigger bucks on set-up men; sixth- and seventh-inning relievers are often also throwing 95 miles per hour.
As a result, bullpens average roughly a strikeout per nine innings more than rotations: starters have a 7.32 K/9 while relievers have an 8.37 rate. (The split between the two has been 0.90 or higher every year since 1998.)
"We've got more depth to pitching staffs right now," Arizona general manager Kevin Towers said this spring. "You've got more solid back-end-of-the-rotation starters. It used to be that you had one big guy at the end [of the bullpen] and you pieced it together to get to him, but now you see more defined roles, power-type arms in the seventh and eighth. Late in the game you've got guys throwing 95, 96 and you get in intense situations, which often times lead to more strikeouts.
"Most of the money was allocated strictly to your starters and the one guy at the back end of the game. Now you're seeing more clubs allocating more dollars, as we have done, to your 'pen."
? While pitchers do still get injured at a pretty high frequency, improved surgical methods and rehabilitation returns an increasing number of them to the mound. Dr. Tim Kremchek, the Reds' chief medical director, said in an interview two years ago that 96 percent of the amateur and professional pitchers on whom he has performed Tommy John surgery return to their pre-injury level of competition. He speculated that rate may be higher for major leaguers.
"I do think medical advances have gotten to the point where, our training staff, our conditioning staffs, are keeping the players healthier longer," Astros GM Jeff Luhnow said. "When they do get injured, they are able to recuperate more quickly and get back on the field."
Among the active pitchers to return from Tommy John surgery at or above their pre-injury levels include Adam Wainwright, Tim Hudson and Stephen Strasburg.
? More pitchers are throwing cutters and other pitches with late movement. The splitter was the pitch of the '80s, the circle changeup was the pitch of the '90s and now the cutter has grown into the pitch of the last decade, and hitters have taken longer catching up.
Pirates veteran infielder Brandon Inge summarized it well: "I see a general progression in the quality of pitches that these guys throw now. For instance, even when I first came up in 2001, there was maybe a handful of guys -- I mean, literally, on one hand I could count -- that had cutters. . . . Now most guys have a straight fastball, a sinking fastball and a cutting fastball. Now you have three pitches on that one, as well as the curve, slider, split, change and God knows what else they're throwing."
? The strikeout has also brokered an uncommon peace between the scouting and sabermetric communities. It's a unifying element between divisive viewpoints, both of which populate front offices.
"The strikeout is sexy," Luhnow said. "Scouts love the strikeout. The sabermetric embraces the strikeout for pitchers and maybe has turned up the volume on the value of the strikeout, and I think scouts always look at and appreciate stuff that leads to strikeouts. It's the one indicator that a pitcher is dominant. It's difficult to point to dominant pitchers that don't have high strikeouts."
? The testing era has clearly taken a toll on offense. Though both hitters and pitchers used performance-enhancing drugs, the data clearly illustrates that homers and runs grew the most during that era.
? Luhnow, a former scouting director with the Cardinals, and one current scouting director both said they haven't seen any appreciable change in strikeout rates among amateurs, suggesting that this is a creation of professional baseball. But, Luhnow added, more baseball players are specializing as pitchers at a younger age.
Three Up, Three Down: Rightfield production
Rightfield has long been a premium offensive position, but less so this year thanks to a few stars enduring season-opening slumps and a few clubs with a personnel staffing issue. The league-wide production from rightfielders has been the position's worst in 21 years, as measured by OPS. Rightfielders have a .745 OPS this season -- it was .815 or higher every year from 1995 through 2003 but it's been declining each of the last six years, down from .804 in 2007 to its current state. When adjusting for run-scoring environment with OPS+, rightfield production this year is even worse, with a 106 OPS+, which is the lowest it has been since 1983.
UP
1. Michael Cuddyer, Rockies. A recent placement on the disabled list with an inflamed disk in his neck is the only thing that has slowed Cuddyer this year. Among rightfielders with at least 100 plate appearances, he ranks first in OPS at .942 while hitting seven home runs.
2. Torii Hunter, Tigers. This is Hunter's second straight age- and BABIP-defying season, as the 37-year-old has a .336/.375/.441 slash line buoyed by a .388 batting average on balls in play.
3. Norichika Aoki, Brewers. Aoki has become one of the game's best leadoff hitters, with a .369 on-base percentage; he has also shown a little more pop than last year, with four homers in his first 34 games after hitting 10 all last season.
DOWN
1. Josh Hamilton, Angels. If highly-paid free-agent slugger finishes the season with his current .584 OPS, it'll be the worst output from a rightfielder since 1919. Hamilton's free-swinging ways are at an all-time high: he is the only AL player to swing at more than 50 percent of all first pitches he sees and his 41.5 percent take-rate on all pitches is the league's lowest.
2. Jay Bruce, Reds. He's getting hot in May (two HRs and an .857 OPS in 10 games) but only after the notoriously streaky hitter sustained his poor production for all of April (one HR, .651 OPS).
3. Jeff Francoeur, Royals. After a bounceback 2011 season (.805 OPS), his next two years in Kansas City have gotten progressively worse, with a .665 OPS last year and a .588 OPS so far this year.
Trend to track: Extra-inning games
Here's another result of the increased pitching dominance: more extra-inning games. Better pitching means lower-scoring games, which means closer games, which in turn often mean more extra-inning games.
Of the 552 games played so far this season, 52 have extended beyond the standard nine frames -- that's 9.42 percent of the total, the second-highest rate since 1996, trailing only 2011's 9.76 percent.
Of particular note are games lasting 13 innings or longer: there have been nine so far this season, which projects to a pace of 40 over the course of the season. That would rank tied for eighth all-time and be the most since 1992, the last offensively-challenged season before the Steroid Era.
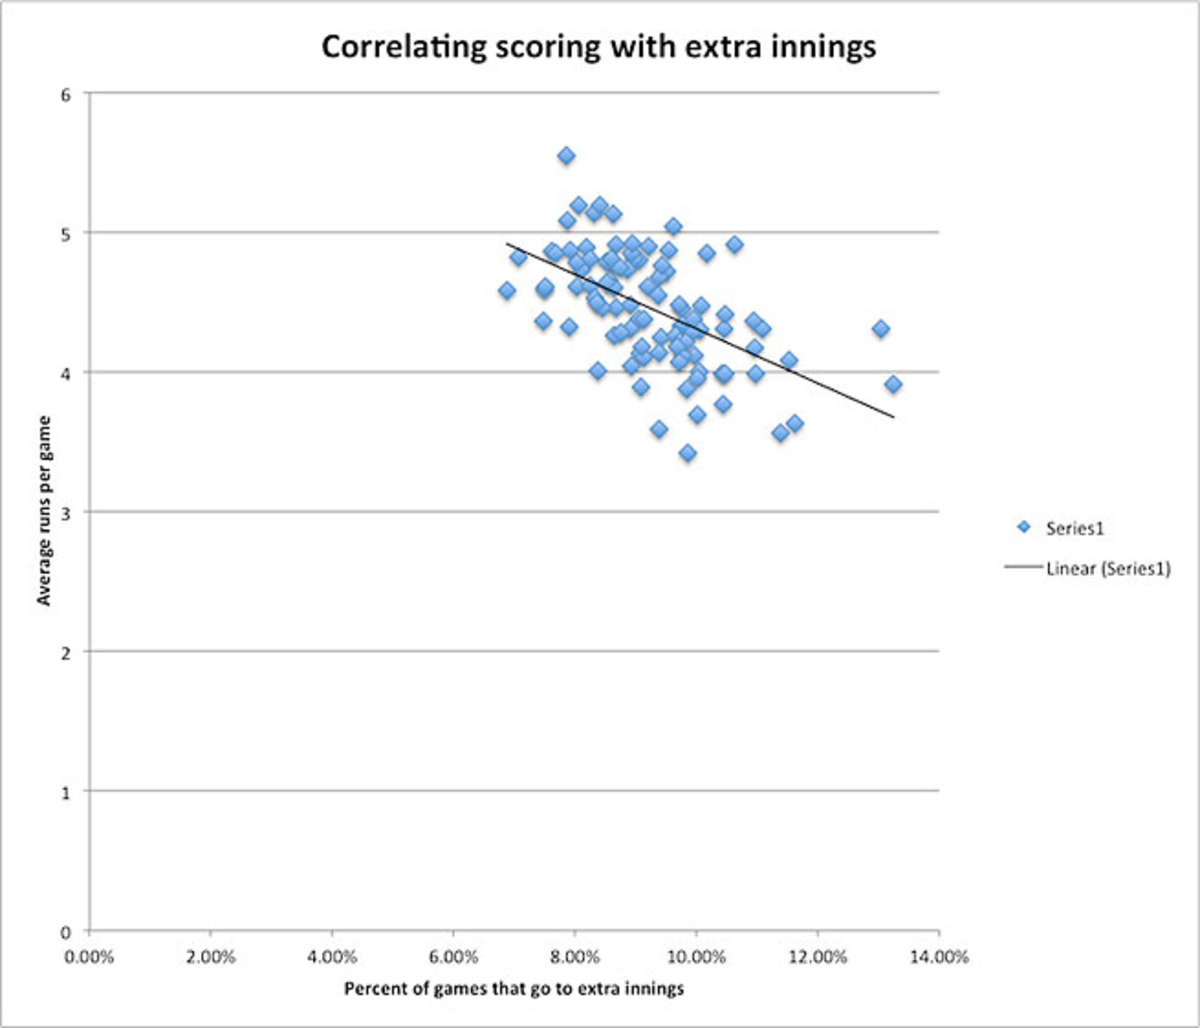
An analysis comparing league-wide scoring with the frequency of extra-inning games unearthed a moderate correlation (a Pearson coefficient of -0.55) between the two, indicating a statistically significant link between the two as seen in this graph:
Another side of . . . Andrew McCutchen, Pirates CF
When McCutchen was a child, he remembers his mother singing Whitney Houston and Yolanda Adams in the mornings, in the car and everywhere in between. His mother sang the national anthem at PNC Park last month and has done so before Pirates' spring training games in Bradenton, about an hour from where McCutchen's parents live in Fort Meade, Fla.
McCutchen inherited some of his musical interest. The two-time All-Star, who finished third in last year's NL MVP voting, stresses that it is just a hobby, but he has some talent too. He used to write poetry in high school and now he'll write songs ("a form of poetry," he noted) and perform at the encouragement of his teammates. Pittsburgh second baseman Neil Walker said last year that his wife requested McCutchen sing at their wedding, and minutes later a teammate produced an iPhone video of McCutchen, lounging on a staircase at the front of a dimly lit ballroom, singing Marvin Gaye.
McCutchen can beatbox, too, and has begun layering his vocals ("more rapping than singing," he said) and beats together into songs. "Once in a blue moon," he said. "Just for fun." One room of his house serves as a makeshift studio, and he learned how to produce music by watching videos online. "Man, you can learn so much on YouTube," McCutchen said. "It's unbelievable."
The final out
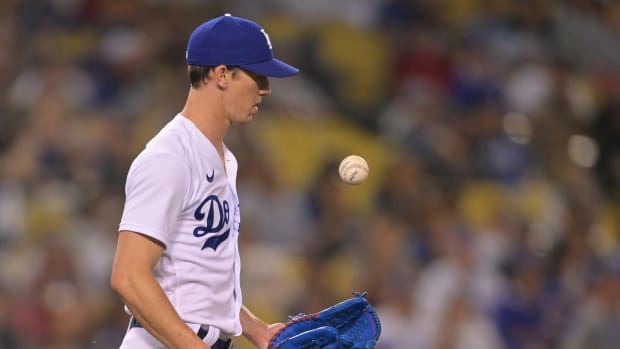
Despite the projected parity of the 2013 season, four teams are on pace to lose 100 games (Angels, Astros, Blue Jays and Marlins) and three more teams are on pace to lose at least 94 (Cubs, Dodgers and Mets). The last time seven teams lost 94 or more games was 2004; on average since then, four teams have lost 94 games in a year -- and never three expected contenders like the Angels, Blue Jays and Dodgers.