The Cubs are struggling more than the average defending champ; more quarter-season notes
Though some teams have played as many as 43 games and others as few as 37, more than one-quarter of the 2017 season will be in the books by Friday’s end. Between the hot starts and cold ones from names both familiar and novel, what follows here are five trends that have caught my eye. Unless otherwise indicated, all stats are through Wednesday.
The Cubs are apparently more hung over than most defending champions
Since no World Series winner has repeated as champion since the 2000 Yankees, I examined the notion that championship-winning teams tend to experience hangovers the following year. What I found suggests that there's something to that, albeit not right out of the gate:
Segment | Winning percentage |
First 20 games | .569 |
First 40 games | .558 |
Last 40 games | .506 |
Last 20 games | .497 |
Overall | .535 |
After winning at a .578 clip during their championship seasons, the 2000–2015 World Series winners fell of by 43 points—seven wins—the year after. Collectively, they maintained a relatively strong pace early in the season but fell apart late, with just seven of those 16 follow-up teams reaching the postseason.
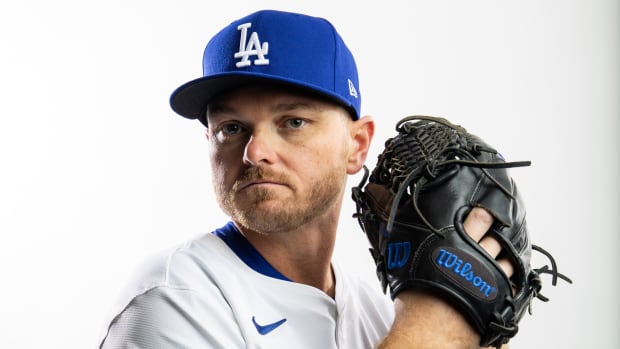
Jon Lester didn't just beat the yips, he improved once the secret was out
Though they couldn't match their own blistering 15–5 start from last year, the Cubs were generally ahead of the curve by going 12–8 (.600) through their first 20 games, a 97-win pace on the heels of a 103-win season. They held sole possession of first place in the NL Central as recently as May 5, but a 2–7 skid earlier this month briefly knocked them below .500, and through 40 games, they're just 21–19 (.525), eight games worse than at this point last year. Among the last 17 ex-champs, only the 2007 Cardinals (16–24) were appreciably worse, while the 2003 Angels, 2014 Red Sox and 2016 Royals were all 20–20. At the end of the year, only the last of those teams managed even a .500 record.
The 2016 Cubs overcame 40-game stretches as bad as 18–22, and 20-game stretches as awful as 5–15, so it isn't out of the question that this year's model rebounds, but right now, a whole lot of things are going wrong, including:
• Five regulars have an OPS+ below 90 through Thursday, namely Addison Russell (69), Kyle Schwarber (79), Wilson Contreras (82), Jason Heyward (87) and Albert Almora Jr. (89). Javier Baez (97) and Ben Zobrist (95) have only pulled themselves above 90 over the last couple of days. Every regular is below last year's performance save for Baez (97, up from 96) and Kris Bryant (152, up from 149).
From title belts to toy dragons, here's why the Houston Astros are baseball's best team
• The rotation's ERA, which last year was a major league-best 2.96, is nearly a run and a half higher at 4.45. The four returning members (Jon Lester, Jake Arrieta, Kyle Hendricks and John Lackey), all have higher ERAs and FIPs than last year, and the same is true for injured fifth starter Brett Anderson relative to the man he replaced, Jason Hammel. Most worrisome is the performance of Arrieta (5.44 ERA), owing to a home run rate that’s more than doubled from last year, from 0.7 per nine to 1.6, and has quadrupled from his Cy Young-winning 2015 season (0.4).
• The team's defense has fallen off mightily as well. Last year's .728 defensive efficiency—the rate at which they turned batted balls into outs—was the highest since the 1991 White Sox, 41 points above the NL average. This year, they're at .680, 12th in the NL and nine points below the league average. The main difference in the lineup is the outfield, with Almora and Jon Jay replacing Dexter Fowler in centerfield, and Schwarber and Jay replacing a large cast headed by Jorge Soler and Bryant in left. That’s translated to more doubles and triples surrendered than last year, from 4.4% of all at-bats to 5.4%.
Most of the other 2016 playoff teams have been sluggish as well
Of the other nine 2016 postseason participants, only the Nationals (25–15), Orioles (23–16) and Dodgers (24–18) are more than two games above .500, with the Giants (17–25), Blue Jays (18–24) and Mets (16–23) all well below the level. In fact, the last three are among the teams with the greatest declines from last year in terms of winning percentage:
Team | 2016 | 2017 | Change |
Marlins | .491 | .350 | -.141 |
Giants | .537 | .405 | -.132 |
Mets | .537 | .410 | -.127 |
Blue Jays | .549 | .429 | -.120 |
Cubs | .640 | .513 | -.115 |
|
|
|
|
Brewers | .451 | .571 | .120 |
Diamondbacks | .426 | .571 | .145 |
Rockies | .463 | .619 | .156 |
Twins | .364 | .541 | .177 |
Astros | .519 | .707 | .188 |
If you're asking, the average playoff team from the same 2000–2015 period I examined fell from .580 to .548, whereas last year’s crop, which won at a .570 clip, is at .511 thus far.
More power to you
Balls are flying out of the park at a record pace beyond even rates seen over the past two decades. As Tom Verducci noted earlier this week, the year-over-year rise from last April to this one was 11.9%. Through Thursday, teams were averaging 1.20 homers per game, up from last year's 1.16 mark and the all-time high of 1.17, set in 2000. As I noted in late 2014, prior to the strike-shortened 1994 season, home runs had only once surpassed the level of 1.0 per game—in the strange, offense-happy 1987 season. They didn't dip back below 1.0 until 2010, and fell as low as 0.86 in 2014. They're up nearly 39% since then.
They're up even more when one considers the trend of fewer balls in play per game. In terms of home runs per batted ball—HR/(AB - SO + SF), often referred to as HR/Con—the current rate of 4.58% is above last year's record-setting level of 4.39%; prior to that, only from 1999-2001 was it ever above 4.0%.
As to why that's happening, it's not a juiced ball, a topic I've investigated in the past and one that The Ringer'sBen Lindbergh has dug into more recently. It's probably not PEDs, either. One theory is that much of the increase is owed to a change in hitting philosophy, with players more conscious of avoiding groundballs and instead trying to hit balls in the air. The wealth of data from Statcast has led players such as Daniel Murphy, Justin Turner, Jedd Gyorko and others to adjust their swing planes in an effort to apply more backspin to the ball while making contact with the bottom of it, which ideally produces an optimal launch angle to send balls out of the park.
After rookie year flop, Jose Berrios beginning to turn the corner for Twins
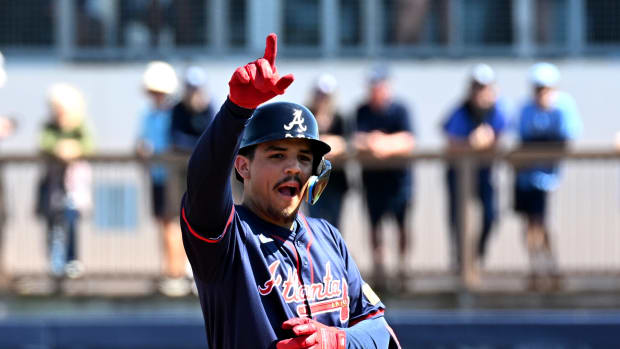
Individually, through Wednesday, 19 players were on pace to hit at least 40 homers, with five on pace to top 50 and two to reach 60. Alas, we can cross one of those two, the Braves' Freddie Freeman, who will be out at least eight weeks with a broken wrist, off of the list. Aaron Judge (14 in the Yankees' 37 games) is also on pace to top 60, while Bryce Harper, Ryan Zimmerman and Eric Thames are the others on pace to reach 50, with Mike Trout, Mark Reynolds and Yonder Alonso‚ whose 12 homers thus far already represent a high for his eight-year career, are just a hair off that pace. Only in 1998 (Ken Griffey, Mark McGwire, Sammy Sosa and Greg Vaughn) and 2001 (Barry Bonds, Luis Gonzalez, Alex Rodriguez and Sosa) have more than two players reached the latter plateau.
Success in relaunching
Speaking of Zimmerman, Harper and Alonso, they head the list of the most improved hitters relative to last season. Among players with at least 350 plate appearances last year and enough to qualify for the batting championship (3.1 per team game played) through Wednesday — a set of cutoffs that allows for some missed time in 2016, even some of the game's best hitters have boosted their OPS+ by at least 50 points:
Player | 2016 | 2017 | Difference |
Ryan Zimmerman | 69 | 202 | 133 |
Bryce Harper | 116 | 220 | 104 |
Yonder Alonso | 91 | 175 | 84 |
Miguel Sano | 110 | 191 | 81 |
Zack Cozart | 92 | 171 | 79 |
Avisail Garcia | 91 | 162 | 71 |
Corey Dickerson | 106 | 173 | 67 |
Buster Posey | 112 | 176 | 64 |
Freddie Freeman | 157 | 211 | 54 |
Mike Trout | 174 | 228 | 54 |
Starlin Castro | 93 | 147 | 54 |
Zimmerman's average exit velocity ranked 12th in the majors last year, though he hit just .218/.272/.370. Unfortunately for him, too many of those hard-hit balls were on the ground. He's improved his average launch angle by about four degrees (from 7.6 to 11.7) and his groundball/flyball ratio from 1.40 to 1.15. Alonso is another player who has consciously altered his approach and the results have been even more dramatic, with his average launch angle increasing from 10.3 degrees to 22.8, and his groundball/flyball ratio plummeting from 1.32 to 0.48.
As for the other end of the spectrum, the players experiencing the biggest falloffs without playing themselves out of the lineup:
Player | 2016 | 2017 | Difference |
Devon Travis | 108 | 60 | -48 |
Hunter Pence | 115 | 67 | -48 |
J.J. Hardy | 88 | 40 | -48 |
Melky Cabrera | 120 | 72 | -48 |
Edwin Encarnacion | 133 | 83 | -50 |
Aledmys Diaz | 133 | 81 | -52 |
Trevor Story | 122 | 68 | -54 |
Jonathan Villar | 118 | 63 | -55 |
Carlos Gonzalez | 111 | 49 | -62 |
Curtis Granderson | 111 | 41 | -70 |
Stringing together strikeouts
Home runs aren't the only thing that's up thus far in 2017. Strikeouts are up as well. On a per nine innings basis, they've risen for the 12th season in a row, from 6.30 in 2005 to 8.03 last year to 8.19 this year, a 30% rise over that span. On a per plate appearance basis, they've risen from 16.4% to 21.4%, with this season the fourth in a row above 20%.
Many factors have contributed to that rise, including increased velocities, specialized bullpens and a reduction of the stigma of striking out. It's not just hard-throwing relievers getting into the act, either. Starters are racking up double-digit strikeout games at a record pace. Last year, an all-time high of 223 of them whiffed at least 10 in a single outing, up from 219 in 2016 and 209 the year before that. With 62 such games thus far, starters are on pace to produce 249 10-K outings.
Leading the way is Chris Sale, who already has seven such outings, and consecutive ones at that. The wiry 28-year-old southpaw is one such start short of his personal record, set in 2015, and three short of Pedro Martinez's major league record of 10, which bridged 1999 and 2000 and was additionally separated by a season-ending one-inning relief stint after his eighth straight. Sale is well positioned to obliterate the single-season record of 13 10-K starts, which he shares with Clayton Kershaw (2015) and Max Scherzer (2016).