Recent results offer evidence that teams should avoid the free-agent market
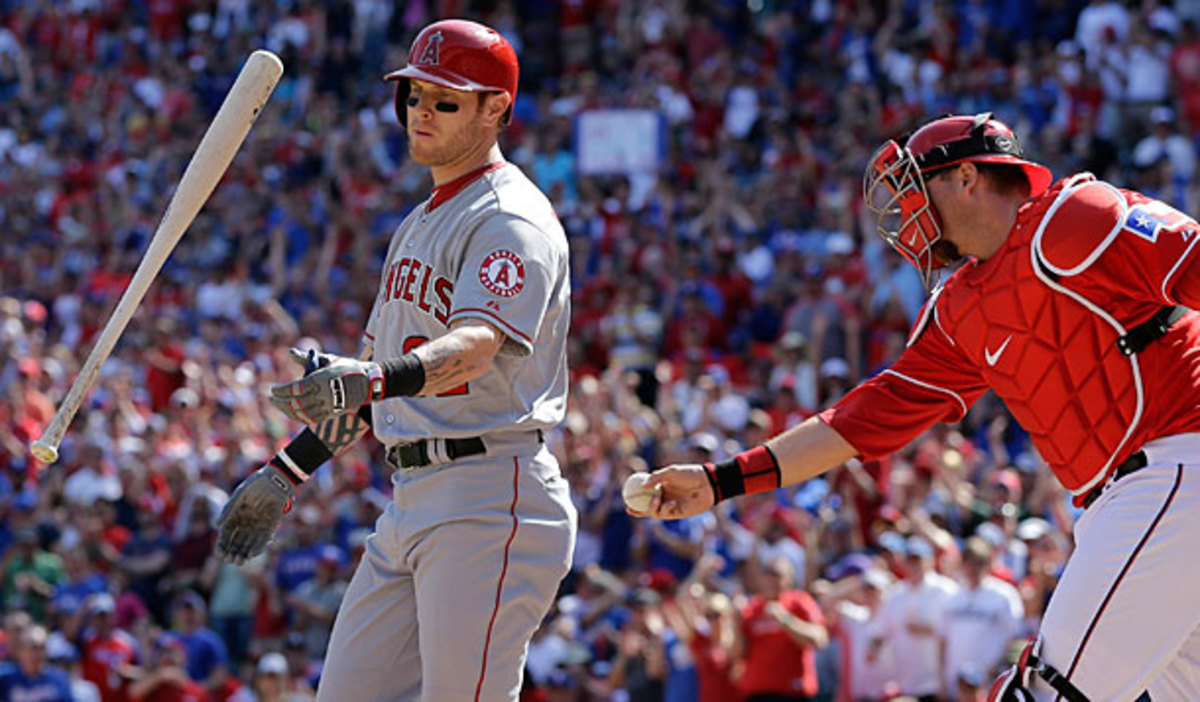
Josh Hamilton is off to a slow start in his first season after signing a five-year, $125 million deal with the Angels. (AP)

With the Angels off to a terrible 11-20 start, much focus has fallen upon the struggles of Josh Hamilton. The 32-year-old rightfielder is hitting just .208/.255/.296 thus far while swinging at just about every pitch between Anaheim and Los Angeles. He's not the only one of the past winter's free agent off to a rough start; B.J. Upton's hitting .148/.231/.269 for the Braves, Adam LaRoche is batting just .168/.273/.295 for the Nationals, Edwin Jackson's carrying a 6.39 ERA for the Cubs and Zack Greinke and Michael Bourn are both on the disabled list.
VERDUCCI: Recent expensive free-agents earn very poor grades
Five weeks into the season, it's too early to pass judgement on those free agent deals, or the ones from this past winter that are off to more auspicious starts. Even so, a quick-and-dirty study I did of the previous five winters' top free agents shows that even in the first year of their new deals, an alarmingly high percentage of players fell on their faces, failing to deliver as much value as they had in their walk years. The findings cut across age ranges, pitcher/position splits, players who switched teams and those who didn't. They bolster the idea that it's better for a team to steer clear of the free agent market and instead focus on retaining their best players — a trend we've noted in this space when it comes to long-term extensions.
To examine this, I used the ESPN Free Agent Tracker to create a pool of 100 players, consisting of the top 20 free agents from each winter following the 2007-2011 seasons according to the total dollar value of their contracts, not including incentive bonuses or discounts from deferrals. The pool covered most but not all contracts worth at least $10 million total during that period, and most but not all Type A and Type B free agents. I excluded players arriving from foreign leagues and those who had missed a season — players whose value (in Baseball-Reference's Wins Above Replacement) couldn't be compared from one year to the next.
Of those 100 players, only 28 delivered as much or more WAR in their first season following free agency (Year 1) as in their walk year (Year 0), a finding that was true whether the players remained on the same team (eight out of 28, 28.6 percent) or changed teams (20 out of 72, 27.8 percent). The average player in the sample was worth 3.0 WAR in Year 0, and 1.7 WAR in Year 1, a drop of 43 percent. Surprisingly, starting pitchers held their value better than other positions, though not by much:
Group | # | Year0 | Year1 | Change |
Overall | 100 | 3.0 | 1.7 | -43% |
Starters | 19 | 3.4 | 2.1 | -39% |
Relievers | 26 | 1.6 | 0.9 | -45% |
Hitters | 55 | 3.6 | 2.0 | -44% |
Among the various positions, four (catcher, second base, centerfield and DH) had fewer than seven players apiece, and only two (third base and leftfield) had more than 10, so I'll skip the position-by-position breakdown except to note that as a group, the 11 third basemen held their value better than any others, averaging 4.2 in Year 0 and 3.4 in Year 1, a drop of only 20 percent; Adrian Beltre hitting the market twice helped to offset the bomb that was Chone Figgins. Bolstered by the inclusion of third basemen in their groupings, infielders held their value better than outfielders in Year 1, and corner players (first base, third base, leftfield and rightfield) better than up-the-middle players (catcher, second base, shortstop and centerfield):
Group | # | Year0 | Year1 | Change |
Infield | 29 | 3.6 | 2.3 | -38% |
Outfield | 22 | 3.4 | 1.7 | -50% |
Middle | 17 | 3.0 | 1.2 | -61% |
Corner | 37 | 3.8 | 2.4 | -38% |
Type A players — those who cost their teams a draft pick if they signed elsewhere — held their value better than other classes, and players who remained with the same team fared better than those who switched. The latter shouldn't be all that surprising given the previous finding that teams tend to fare better when retaining their own free agents than by signing other peoples' players, likely due to the information asymmetry with regards to health and fit into a given environment:
Group | # | Year0 | Year1 | Change |
Type A | 42 | 3.5 | 2.2 | -39% |
Type B | 20 | 2.2 | 1.0 | -57% |
Unranked | 38 | 2.9 | 1.5 | -49% |
Same team | 28 | 3.3 | 2.2 | -34% |
Changed team | 72 | 2.9 | 1.6 | -47% |
Furthermore, the very top free agents held their value better than the rest. Breaking it down into quintiles of around 20 members each, but without separating equally valued contracts across groups (all dollar values in thousands):
Total $ | # | Year0 | Year1 | Change |
$56+ | 20 | 5.1 | 3.4 | -34% |
$35-$52.4 | 19 | 3.5 | 1.5 | -58% |
$17.5-$31.5 | 21 | 2.4 | 1.3 | -47% |
$14-$16.5 | 19 | 2.3 | 1.3 | -41% |
$7.5-$13.5 | 21 | 1.9 | 1.2 | -37% |
If we consider just the contracts worth $100 million or more, the 10 players in the sample averaged 6.0 WAR in Year 0 and 4.7 in Year 1, a drop of "only" 22 percent. Note that it's the bottom quintile where some players were likely to slip through the cracks based upon my arbitrary cutoff of 20 players per year, so any conclusions about those lower-valued players should be taken with an even larger grain of salt than the rest of this study.
Agewise, the oldest players were better bets than the youngest ones, though both samples were small enough to suggest a selection bias at work; prime-aged players may have been more likely to receive extensions or have their options picked up by their current teams (thus excluding them from the sample), and old players may have received less valuable deals that fell below the threshold of this study:
Ages | # | Year0 | Year1 | Change |
26-28 | 11 | 3.6 | 1.8 | -52% |
29-31 | 44 | 3.2 | 1.8 | -42% |
32-34 | 32 | 2.6 | 1.5 | -42% |
35+ | 13 | 3.0 | 1.9 | -38% |
The old group was also skewed by the resilience of Mariano Rivera, who hit free agency after the 2007 and 2010 seasons and improved the following year both times; without him, the 35+ sample went from 3.2 to 1.5 WAR and lost 52 percent of its value in Year 1, same as the 26-28 group.
The aging pattern is less clear if we separate hitters from pitchers, likely because the 26-28 and 35+ groups for each contain small samples seven or fewer players. If we aggregate the groups into 31 and under and 32 and older, it's the venerable hurlers who hold their value slightly better than the rest — but only if we include Rivera, ever the outlier:
Group | # | Year0 | Year1 | Change |
Hit under 31 | 31 | 3.9 | 2.1 | -44% |
Hit 32+ | 24 | 3.2 | 1.8 | -42% |
Pitch under 31 | 24 | 2.5 | 1.4 | -44% |
Pitch 32+ | 21 | 2.1 | 1.3 | -38% |
Pitch 32+ and Rivera | 19 | 2.1 | 1.1 | -50% |
While revealing, this study is far from definitive. The various cutoffs — five years, 20 players per year, total dollar value of contracts — were somewhat arbitrary, necessitated by the time constraints of manually gathered data. It's quite possible that at the lower and less risky end of the free agent pool, players retain their value better, in part because if they're not drawing big contracts, there's less room to fall off and less likelihood of significant regression, whereas for a six-win player hitting the market, the tendency to regress is much stronger.
Still, all of the players within this pool represent substantial investments by their teams. Even without considering the dollars-per-win return or the long-term value of the deals, it's clear that teams did not get nearly as much immediate help as they might have expected; it's just not that easy to buy a three-win player —i.e., an above-average one — off the rack and expect he'll deliver three wins in the following season.
One trend that bears closer watching is whether the spread of statistical analysis to more front offices is increasing teams' awareness of what a sucker's bet free agency is. The one-year rate of return on qualifying 2007 free agents was by far the lowest in the study, while for 2011 ones, it was by far the highest. In order by year: 2007: −68%, 2008: −44%, 2009: −36%, 2010: −49%, 2011: −4%. Interestingly, the average 2011 free agent had the lowest value in Year 0 (2.5 WAR, compared to 3.1 or 3.2 in the other years) yet produced around 50 percent more value in Year 1 (2.4 WAR) than any of the other groups.