How good has Matt Kemp's April been? It's one of the best ever

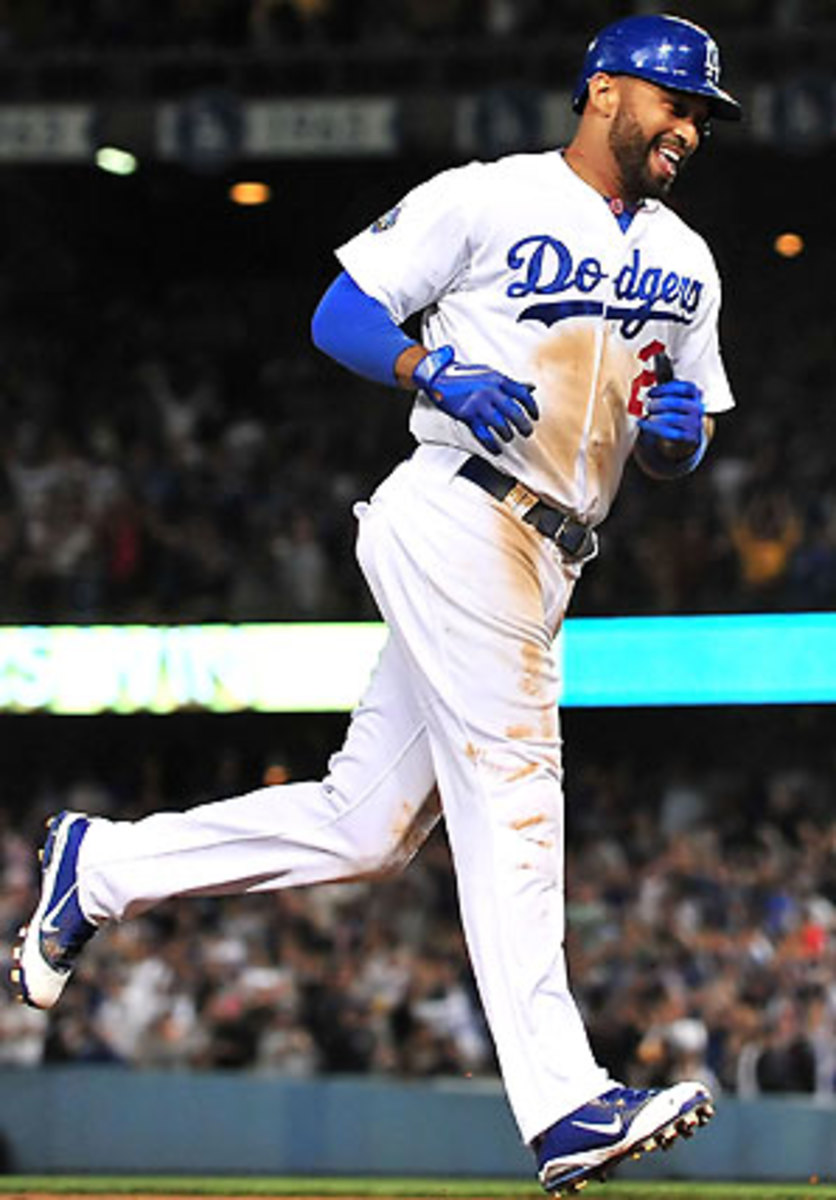
Matt Kemp is off to an incredible start this season, hitting .425/.495/.888 with 11 home runs and 24 RBIs through Sunday. He's so hot that it has prompted the question as to whether or not Kemp is having the greatest April ever by a hitter, and if not, just where he ranks on the all-time list. (For a look at hot starts by pitchers see my story on Jered Weaver from a year ago.)
The easy answer is that Kemp isn't having the best April ever. With one game left to play, Kemp is going to fall far short of Barry Bonds' 2004 performance, even though Kemp's counting stats outpace those of Bonds, who had 10 home runs and 22 RBIs but but put up the absurd slash-line of .472/.696/1.132.
Unless he has a game for the ages in Denver on Monday, Kemp will also fall short of the April records for home runs (14 by Albert Pujols in 2006 and Alex Rodriguez in 2007) and RBIs (36 by Juan Gonzalez in 1998, including one on March 31 -- note that, where applicable, the April splits below include games played in March).
As for where his April will fall on the all-time list, that's a more difficult question to answer, and one I can only answer in part. To my knowledge, the best source for searchable monthly splits is David Pinto's Day By Day Database, and Pinto's data only goes back to 1974. So, short of searching every season of every player's career individually, we'll have to settle for a list that only covers 1974 to the present. Fortunately, that's the bulk of the data as, prior to the 1961 expansion, the major league season didn't start until late April, meaning Ted Williams and Babe Ruth and the like never played more than a dozen games before May.
The other challenge is how to quickly compare performances by different kinds of hitters over a nearly 40-year span during which the balance between hitting and pitching changed radically without the benefit of an easily-digested advanced statistic like Wins Above Replacement. I'll start with a favorite shortcut of mine called Gross Production Average (GPA). That stat goes a step further than OPS by combining on-base percentage and slugging percentage, the two most important hitting statistics, in a manner that gives proper weight to the former (avoiding outs is more important than hitting for extra bases, something GPA expresses by multiplying OBP by 1.8 before adding it to slugging), and then converts the result to a scale similar to traditional batting average (.260 is average, .300 is good, .200 is lousy, etc.).
Using 60 plate appearances as a minimum playing time requirement, I get a list, sorted by GPA, that looks like this (with GPA taken out an extra decimal place to break some of the ties that arise):
Bonds' 2004 performance, which contains the April records in all three slash stats in that period since 1974, is so far out in front that it should remain number one even after adjusting for the hitting-happy era in which it occurred, but it's pretty easy to move George Brett's performance hitting at Royals Stadium in 1983 ahead of Larry Walker's hitting in Coors Field in 1997. For some context, here's that same list with the league-wide GPA for April of the given year:
A few things stand out there. Looking at the National League's 1997 splits, the ball didn't start jumping until May (.252 league GPA for that month), which puts Walker and Brett on surprisingly even footing above, at least before you factor in their ballparks. On the flip side, it's easy to forget that the addition of two expansion teams helped American League teams average an extra half a run per game in 1977 compared to 1976, or that the American League teams averaged 5.23 runs per game before the strike hit in 1994, a season in which the league as a whole hit .273/.349/.440 in April.
Most significantly for our purposes, however, is that Kemp's April has taken place in the toughest hitting environment for any of the 14 players above. If we take the player GPAs as a percentage of the league GPAs, a rough approximation of what OPS+ does so let's call it GPA+, we get a list that looks like this:
Kemp moves up from 11th to seventh here. Also, note that the four Aprils above him -- Bonds in 2002, Walker in 1997, Ron Cey in 1977 and Brett in 1983 --are pretty tightly bunched from 190 to 193 percent of league GPA, just above Kemp's 188. Those performances are close enough that Kemp could catch or even pass them with a big day on Monday, though an 0-for-5 could similarly knock him down to 12th (a good illustration of the problem with small samples).
With that one game remaining, however, Kemp has clearly had one of the 10 most productive Aprils by any hitter in the last 39 major league seasons, which is impressive enough that his exact placement on that list shouldn't matter.