Analytics Tracker: Week 6 Statistical Deep Dive
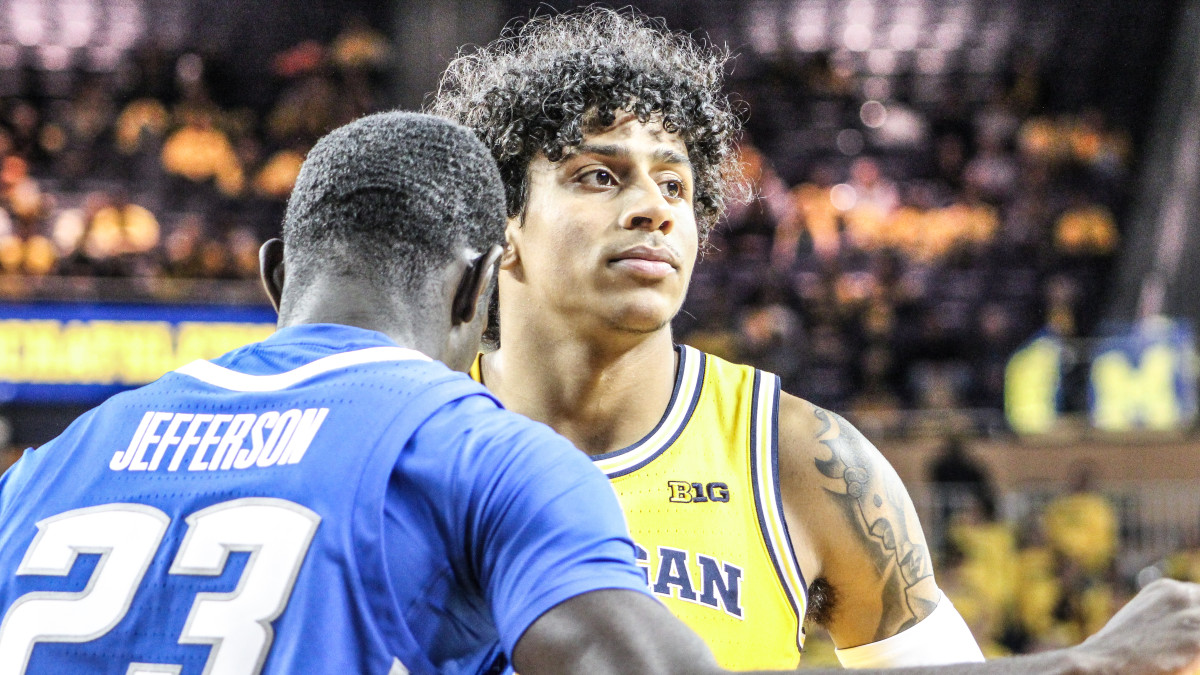
One of the more significant changes promised under first-year head coach Juwan Howard was a faster offense and a heightened focus on transition baskets than a year ago, in which Michigan was 13th in Big Ten and 317th in the country with an Adjusted Tempo of 64.8, according to KenPom advanced statistics.
The Wolverines have utilized a moderately more urgent pace this season with a 69.7 Adjusted Tempo that is the eighth fastest in the conference and 176th in the country. Although this may not be quite the boost in speed of play expected, U-M has found immense success when it has decided to push the action. In games in which Howard’s squad has played at an Adjusted Tempo of 70.0 or better, it is 6-0 and has outscored opponents by 97 points, or 16.1 points per game. From an efficiency standpoint, Michigan has averaged a 116.1 Offensive Rating (ORtg), 62.4 Effective Field Goal percentage (eFG%), 59.4 two-point shot percentage and 44.6 three-point shot percentage in these contests.
In its three losses this season, however, U-M struggled to dictate their desired pace against teams with a more plodding approach. Louisville’s 67.2 adjusted tempo is 274th in the nation, Illinois’ 69.3 is 188th and Oregon’s 65.0 ranks 310th. In these three matchups, Michigan’s average tempo was just 65.0—more than eight points lower than the 73.1 it’s played at in its eight wins.
There has been a direct correlation between speed of play and offensive efficiency during the Wolverines’ recent slump, in which its lost three of four games. In these three setbacks, Michigan has managed an average ORtg of 86.2, a 40.9 eFG%, and are shooting 42.3 percent from two-point range and 25.9 percent from beyond the arc.
Of U-M’s Big Ten conference foes, eight are ranked lower than 150th in the country in Adjusted Tempo and five play at a pace that places them below No. 200. Only two conference teams are in the top 100 in the nation in pace, with none in the top 25. As the conference season progresses, Michigan will see no shortage of teams game-planning to slow them down. The effectiveness in which Howard’s team can force the action will play a critical role in its spot in the conference standings heading into March.
Here is a look at other player and team-specific trends and advanced statistics using the KenPom model. If you are unfamiliar with KenPom and its metrics, you can read a quick primer here.
*To qualify for individual conference rankings, players must log between 40 percent and 60 percent of possible minutes played, depending on the metric.
Key Trends:
•Senior point guard Zavier Simpson continues to distribute the ball at a high-clip with a 47.2 Assist Rate (ARate) that leads the Big Ten and is the third-best in the country, but it is his teammates’ ability to make the extra pass that has been a key win-loss indicator this season. In wins, Simpson is accounting for 52.5 percent of Michigan’s 17.9 assists per contest, with teammates contributing an average of 8.5 helpers. In losses, 68.8 percent of U-M’s 10.7 assists per game are dished by Simpson, with the rest of the Wolverines adding only 3.3 assists per game.
•Oregon shot 50.0 percent from three-point range against Michigan, becoming the second team this season to accomplish this feat. In 11 games, U-M has held nine opponents to 35.0 percent or less shooting from beyond the arc and six under 25.0 percent.
•With its 58.5 eFG%, the Ducks became the first team to shoot notch a 50.0 or better eFG% against Michigan this season. The Wolverines have limited nine foes to an eFG% under the national average of 49.2 on the year.
•In its last four games, the Maize and Blue have been outscored 150-104 in the paint, or an average of 37.5-26.0 per contest.
•Led by senior Jon Teske, the center position has scored 24.5 percent of U-M’s points this season, 4.9 percent higher than the national average for point production from the five spot. The scoring output from each of the other four positions is below the national average, with the lowest being 17.8 percent from from power forwards. Michigan Centers have also accounted for 48.0 percent of offensive rebounds and 32.8 percent of defensive rebounds, both more than 11 percent higher than the national average for the position.
Starting 5
Point Guard: Senior Zavier Simpson
Traditional Stat Line (Per Game Averages): 11.6 points, 8.8 assists, 4.3 rebounds
In Michigan’s three losses this season, Simpson has averaged an ORtg of 76.7—more than 33 points below his 109.8 season average. In these contests, he is shooting just 30.5 percent from the field and has missed all five of his three-point attempts.
Shooting Guard: Junior Eli Brooks
Traditional Stat Line (Per Game Averages): 10.8 points, 2.5 assists, 3.2 rebounds
With two ORtgs under 40.0 in his last four games, Brooks’ overall ORtg has fallen below 100.0 for the first time this season. The junior guard is the only Wolverine shooting below 40.0 percent from two-point range this season, converting only 24 of 61 attempts (39.3 percent).
Small Forward: Junior Isaiah Livers
Traditional Stat Line (Per Game Averages): 14.6 points, 1.2 assists, 3.5 rebounds
Over his last three games, Livers is shooting 53.8 percent from beyond the arc, improving his season average to 50.0 percent (4th Big Ten, 25th nationally). His 58 three-point attempts on the season are the most of any player in the country shooting 50.0 percent or better.
Power Forward: Freshman Franz Wagner
Traditional Stat Line: 9.6 points, 0.6 assists, 3.4 rebounds
Despite a sterling 155 ORtg and 76.9 eFG% against Oregon, Wagner has been inconsistent this season. In four games in which he’s registered an ORtg of 100.0 or better, he is averaging a 129.0 grade in the metric. In the three outings that he has logged less than 100.0 in the statistic, his average ORtg is just 49.7.
Center: Senior Jon Teske
Traditional Stat Line: 13.4 points, 1.0 assists, 8.5 rebounds
Teske continues to produce statistically on both ends of the court, making 14 of 18 two-point attempts (77.8 percent) and blocking six shots over the last three games. His three shot attempts against Oregon were the fewest he’s taken in a game in which he played at least 20 minutes since Feb. 12, 2018.
Off the Bench (Played in at least 10 percent of teams total minutes)
Sophomore Guard David DeJulius
Traditional Stat Line: 8.0 points, 1.3 assists, 2.8 rebounds
After a tough four-game stretch in which he was held to 5.0 points per game and a 40.5 eFG%, DeJulius rebound against Oregon with an efficient 14 points and 66.7 eFG%. In his last seven games, the Detroit native is averaging 12.0 points per game when playing 20 minutes or more, but is scoring just 3.7 points per game when playing less than 20 minutes—during this stretch, he has not played fewer than 18 minutes in a game.
Sophomore Forward Brandon Johns Jr.:
Traditional Stat Line: 4.1 points, 0.4 assists, 4.5 rebounds
Johns played a career-high 22 minutes against Oregon and logged a 28 Percentage of Possessions Used (%Poss) raing, the most of any Wolverine in the tilt. After averaging 3.0 offensive rebounds per game over the last three, his Offensive Rebounding Percentage (OR%) has climbed to a team-best 12.5.
Sophomore Center/Forward Colin Castleton:
Traditional Stat Line (Per Game Average): 4.2 points, 0.2 assists, 2.5 rebounds
Over the last six games, Castleton has seen action in just 17.5 percent of available minutes and is averaging the same number of personal fouls as shot attempts (0.8). In the first five games of the season, he played in 31.0 percent of possible minutes and attempted 4.6 field goals per contest.
Sophomore guard Adrien Nunez:
Traditional Stat Line (Per Game Average): 2.7 points, 0.1 assists, 0.0 rebounds
Nunez played a combined nine scoreless minutes against Illinois and Oregon, going 0 of 2 from the field and committing one turnover. His 87.0 ORtg, 44.4 eFG% and 25.0 three-point shooting percentage are all team lows.
KenPom Most Frequent Lineup Combinations (last five games):
1. Simpson, Brooks, Livers, Wagner, Teske — 37.3%
2. Simpson, DeJulius, Livers, Wagner, Teske — 9.2%
3. Simpson, DeJulius, Brooks, Livers, Teske — 7.0%
4. Simpson, Brooks, Livers, Wagner, Castleton — 4.1%
5. Simpson, DeJulius, Livers, Johns, Teske — 3.6%
KenPom Depth Chart (last five games):
PG: Simpson (85%), Brooks (14%)
SG: DeJulius (48%), Brooks (47%)
SF: Livers (71%), Brooks (15%), Wagner (9%), Nunez (6%)
PF: Wagner (61%), Johns (24%), Livers (14%)
C: Teske (72%), Castleton (18%), Johns (5%), Davis (5%)
Who has stood out to you so far? Who needs to step it up? Comment below!!!

