Need for Speed: MLB's Hardest Throwers Are Paying a High Price
First Luis Severino broke. Then Chris Sale. Now Noah Syndergaard. When it comes to pitching health, these are hard times for hard throwers.
All three were All-Star pitchers in 2018. All three were among the 20 hardest-throwing starting pitchers in the majors that year. Severino and Syndergaard ranked 1-2. Sale just made it inside the top 20, as did Michael Fulmer, Jameson Taillon, Chad Kuhl and Shohei Ohtani, if he had lasted long enough to qualify.
All of them had Tommy John surgery in the past 17 months to repair a torn elbow ligament. The breakdown rate is staggering: one-third of the 21 hardest-throwing starters blew out in less than a year and a half.
After the latest blowout, the one to Syndergaard, it’s time to ask some serious questions about the connection between velocity and health.
Is velocity still going up? Are pitchers throwing too many fastballs? Does throwing harder increase the chance of a breakdown? Does throwing harder increase the stress on the elbow? Are pitchers pushing against the wall of the human limit in velocity? Put another way, are pitchers throwing too hard for their own good? Is velocity overrated?
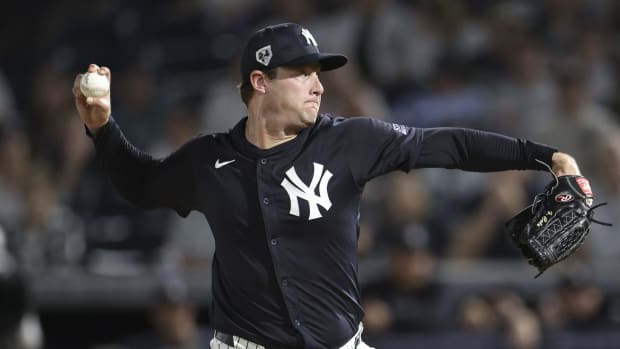
And what does this trend mean for Gerrit Cole? The New York Yankees just invested $324 million in the pitcher who threw harder than every starter last year except Syndergaard and Nathan Eovaldi, another Tommy John surgery recipient.
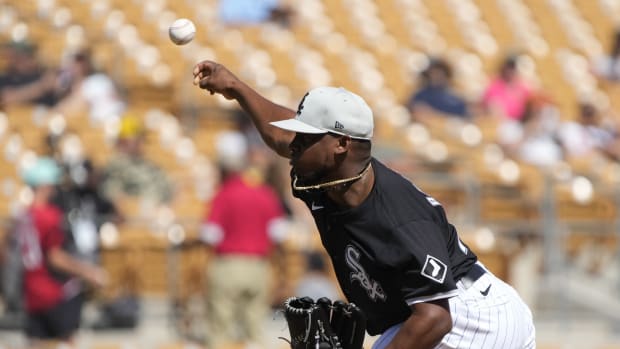
Research on the connection between velocity and health is ongoing. But with the help of data and science we can begin to answer those questions. We should start with Syndergaard, because he is not only the latest to break down, but also an outlier among outliers.
Over the past five seasons, even though he had three of those seasons truncated by injuries, Syndergaard lit up radar guns more than anybody else–way more. Syndergaard threw 5,078 fastballs in those years clocked at 97 mph or faster. That was 51% more such high-octane gas than anybody in baseball. (Aroldis Chapman was a distant second at 3,356, Cole third at 3,019 and Severino fourth at 2,601).

Erick W. Rasco
Did Syndergaard’s elbow simply give out from throwing so hard so often? That’s too simple and too speculative. We know from scientific research the two greatest threats to a pitcher’s health are overuse and poor mechanics.
It’s difficult to think Syndergaard pitched through fatigue because of overuse. He never threw more than 118 pitches in a start, reached 110 pitches in only 10 of his 118 starts, and made 60% of his starts with “extra” rest (five days or more). The New York Mets worked him conservatively.
Mechanically, Syndergaard has a somewhat unusual arm stroke. Greg Maddux used to talk about creating two “Ls” with his right arm: one, inverted, when he takes the ball out of his glove and down, and a second, upright, when he gets the ball to the loaded position to throw. When Syndergaard takes the ball out of his glove he pulls it back, not down, without much of a bend in the elbow joint. I’m not a fan of pitchers taking the ball over or behind the airspace of the pitching rubber, be it Johan Santana or Chris Narveson.
Syndergaard also has worked to improve a timing issue in his delivery. The ball should be in the raised or “loaded” position when the front foot lands. That was a bigger issue for him early in his career.
It’s not a textbook delivery, but the questions here are about velocity. Did throwing so hard put Syndergaard at risk? Let’s begin by attacking the questions raised above.
Is velocity still going up? Are pitchers throwing too many fastballs?
In order, yes and no.
People have talked for years about velocity going up, but in recent seasons it had plateaued. The average fastball actually went down a tick in 2017 (92.8 mph) and in 2018 (92.7; I’m including all fastballs and excluding cutters, as I do throughout.)
Then last year we saw a sudden, significant spike in velocity to 93.1 mph. My theory? The baseball. We know from scientific research the ball had less drag last year. We talk about less drag in terms of batted balls flying farther, but less drag also aids fastballs. They cut through the air with less resistance.
Counterintuitively, as pitchers are throwing faster, they are throwing fewer fastballs–fewer than ever. Fastball use is declining steadily. Major League Baseball keeps moving closer to being a “50-50” game: an even split between fastballs and non-fastballs. Here’s a good look at the inverse relationship between velocity and fastball use:
MLB Fastballs
MPH | Pct. | |
2015 | 92.7 | 56.8% |
2016 | 92.9 | 56.3% |
2017 | 92.8 | 55.4% |
2018 | 92.7 | 54.6% |
2019 | 93.1 | 52.0% |
You might think the increased velocity has something to do with more relievers (who as a group throw harder than starters) and more openers. But also, starters are throwing harder than ever: Fastball velocity in the first three innings is up to 92.7 mph, from 92.3 in 2017.
Does throwing harder increase the chance of a breakdown?
When it comes to Tommy John surgeries, the data suggest yes, it does.
There have been 44 major league pitchers over the past three years who underwent Tommy John surgery. Thirty-two of those 44 Tommy John recipients–73%–had above-average fastball velocity.
Let’s compare the Tommy John recipients to the overall MLB pitching population:
Tommy John Pitchers | All MLB Pitchers | ||
No. | Avg. Velocity | Avg. Previous Year | |
2020 | 5 | 93.8 | 93.1 |
2019 | 16 | 93.6 | 92.7 |
2018 | 23 | 93.6 | 92.8 |
Totals | 44 | 93.7 | 92.9 |
Sure, you can find the occasional soft thrower such as Steven Wright or Brent Suter. But pitchers who had the surgery in the past three years threw on average almost a mile per hour faster than the average pitcher.
Does throwing harder increase the load (known as elbow-varus torque) on the elbow?
Ok, enough anecdotal information. You want serious, published scientific research? You got it.
Last year the American Sports Medicine Institute in Birmingham, Ala., studied not only previous biomechanical data on 452 professional pitchers but it also performed a retrospective analysis on 64 pitchers using three-dimensional motion capture. The researchers’ objective was to measure the relationship between fastball velocity and elbow-varus torque in pro pitchers.
Here’s what they found: “Overall, the results of these studies have suggested that increased velocity does increase the injury risk.”
Now the details. Velocity explained only a small percentage of the variance in load between subjects (7.6%). That’s where anthropometrics and mechanics come in (how you’re built and how you throw, i.e. mechanics).
But within the individual, velocity accounted for almost all the variance in elbow-varus torque (95.7%).
What you suspected from the bleachers appears to be scientific fact: as a pitcher increases velocity, he increases the stress on the elbow.
Are pitchers throwing too hard for their own good?
The fastest of all human motions is the angular velocity of the upper extremity during the throwing process. Major League pitchers throwing a baseball 100 mph or faster take this motion near the human limit.
Like your tachometer, there does appear to be a “red line” when it comes to generating elite ball velocity. Again, we will zero in on starting pitchers, who are throwing more pitches than relievers and so are more vulnerable to their effects. Studying the data from the past five seasons, this “red line” seems to begin at an average fastball velocity of 96.5 mph. Only about six starting pitchers per year average such a high speed. Those that do break down more frequently than the general pitching population.
Over the past five years, 18 starting pitchers have averaged 96.5 mph or more with their fastball in a season (some multiple times). Eleven of those 18 have had Tommy John surgery, or 61%. The overall Tommy John rate among MLB pitchers is about 25%.
Is velocity overrated?
Yes. In general, more velocity does give a pitcher a greater margin for error with command. Missing down the middle at 97 is slightly less risky (.336) than missing in the same spot at 90 (.353). Batting average does decline as fastball speed goes up.
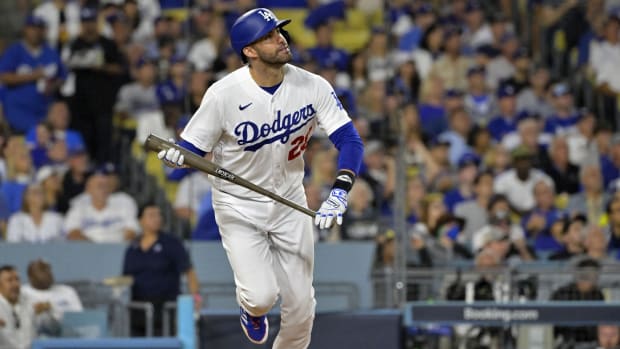
But there is a reason why pitchers are throwing fewer fastballs: major league hitters have trained on and grown accustomed to velocity. As the saying goes, they can time a jet. Last year they hit .248 against elite fastballs (96+ mph)–25 points better than against average breaking and off-speed pitchers. They hit .292 against Syndergaard’s fastball.

Rob Tringali
(Velocity is just one marker of a fastball’s effectiveness. It carries popular significance because for about 30 years it was the only one we had. With military-grade diagnostic devices now we understand much more about how the baseball spins and tracks. Remember those 5,078 97-plus fastballs Syndergaard has thrown in his career? Sounds impressive, but batters hit .266 against them. That’s an extraordinarily high number for pitches that fast. The MLB average in that time against such heat is .235. Batters hit better against Syndergaard throwing 97-plus than they did overall, .253.)
In their study, the folks at ASMI looked at traditional and non-traditional metrics over a three-year period (2015-17) according to pitch type. Their conclusion: “Fastball velocity was weakly correlated with these metrics, which suggests that the strength of the relationship between ball velocity and performance may be overstated.”
Should Cole be worried?
The most fascinating part of the ASMI study was a suggestion in its conclusion: pitchers should throttle back on their velocity.
“A deliberate reduction in velocity without compromising mechanics will likely reduce the load on an individual pitcher’s elbow,” said the report. It added that pitchers should learn “to recognize when using maximum velocity becomes necessary. Major League teams with the ability to recognize when pitchers lack these attributes (i.e., pitchers who require ‘maximum effort’ for success) may be able to avoid potentially costly mistakes.”
One good example is Stephen Strasburg of the Washington Nationals. When he reached the big leagues in 2012 he hit 96 mph 1,020 times–and soon blew out his elbow. By 2018 he was down to 188 such pitches. And last year, he hit 96 mph only 14 times in what was his biggest season in terms of workload. In the past five years he has cut his average fastball from 96.1 mph–close to that red line–to 93.9 mph.
Unlike Syndergaard, Cole seems already to have employed the kind of deliberate velocity tapering recommended by ASMI. While Cole certainly pitches above the red line with his fastball–he averaged 97.1 mph last year–he is not a “max effort” pitcher.
First, we can see that Cole does have cleaner mechanics than Syndergaard. But you can clearly see the difference between velocity tapering and max effort in how they use their fastball according to the count:
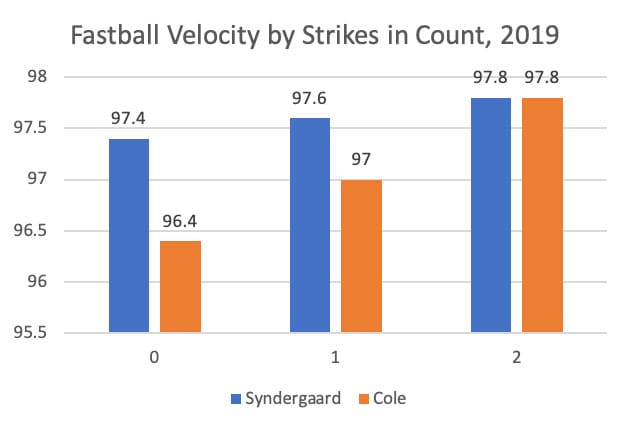
Look at the two-strike fastball speeds. Syndergaard and Cole throw their put-away fastball at the same velocity. How they get there is very different.
With no strikes, Cole actually is a tick below the 96.5 red line. He has two more gears he can hit. Savvy pitchers call this “adding and subtracting” with their fastball. On the other hand, Syndergaard is using close to his top-line fastball all the time. There is no throttle.
Let’s call the difference in velocity between a zero-strike fastball and a two-strike fastball the Fastball Delta (FD). Cole’s FD of 1.4 mph is three and a half times greater than Syndergaard’s FD of 0.4. Among a select group of the hardest throwing starting pitchers, Syndergaard is near the bottom in FD, which means he is maxing out more often.
1. Justin Verlander, Astros (1.5 FD)
2. Gerrit Cole, Yankees (1.4 FD)
3. Brandon Woodruff, Brewers (1.2 FD)
4. Luis Severino, Yankees (1.0 FD)
5. Zack Wheeler, Phillies (0.9 FD)
T6. Stephen Strasburg, Nationals (0.9 FD)
T6. Tyler Glasnow, Rays (0.9 FD)
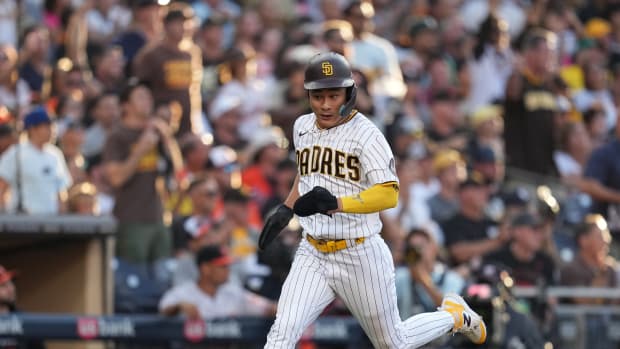
T6. Dinelson Lamet, Padres (0.9 FD)
MLB Average ( 0.9 FD)
T9. Jacob deGrom, Mets (0.8 FD)
T9. Jon Gray, Rockies (0.8 FD)
11. Walker Buehler, Dodgers (0.7 FD)
T12. Dustin May, Dodgers (0.4 FD)
T12. Noah Syndergaard, Mets (0.4 FD)
14. Nathan Eovaldi, Red Sox (0.3 FD)
Syndergaard was a wonder to behold. He struck out more batters in his first 119 games than all but 10 pitchers in baseball history. (To give you an idea of how pitching and hitting have changed in a swing-and-miss game, seven of top 13 on that list are active.) He walked out to the mound like he owned the joint, never more so than when he whizzed the first pitch of a World Series game past the coconut of aggressive-swinging Alcides Escobar.
There was nobody quite like him. You know those 5,078 fastballs he threw over the past five years that clocked in at 97 mph or faster? He wasn’t just ahead of all other pitchers by more than 50%. Even missing about 35 starts, he threw more 97-plus heaters in those five years than 21 of the 30 major league teams! Syndergaard was to high-velocity fastballs what Babe Ruth was to home runs in the 1920s.
Former Mets GM Sandy Alderson used to say he preferred Syndergaard learn to throttle back even a hair with his fastball, if only for the sake of improving on the craft of pitching, not as if he were trying to win showcases. No can do, Syndergaard would say. He was built for speed and reveled in extracting every bit of it. The idea of maintaining a 100-mph fastball late in games motivated him. He would say hitting the throttle on his fastball by even 10% would cause him to lose command, not gain it.
Admit it. We love velocity as much as he does. It’s why ballparks and telecasts flash the speed of every pitch. It’s why we look at the fastball pitcher like the gunslinger in old Westerns: a bold, deadeye dude with a halo of dangerousness that wins our rooting interest.
If there is baseball this year, there will be no Syndergaard, no Severino, no Sale, and probably none of them on Opening Day 2021, either. It is our loss as well as theirs. It’s the high price of high velocity. A gunslinger’s work is dangerous business.