Relief Pitching Is Out of Control
For three decades beginning in the 1930s, the Soil Conservation Service touted what it considered an ornamental plant to control soil erosion in the South. That plant, a vine known as kudzu, grew at the astounding rate of one foot every day. Kudzu grew out of control. It was a killer. It wiped out grasses, plants and trees by choking off their sunlight. Kudzu acquired another name: “the vine that ate the South.”
Relief pitching is baseball’s Kudzu. Its growth is overtaking the game. In the past postseason, the World Series champion Braves used relief pitchers to cover 55% of their innings and 64% of their wins—right in line with the overall rates of 55% and 62%. The more pitchers are used, the longer it takes for a ball to be put in play.
Get SI’s Atlanta Braves World Series Champions commemorative issue here.
This month the players association is in collective bargaining talks with MLB. The players want teams to be as competitive as they are, which means the best players play regardless of service time and teams spend money to try to win, not put it in their pockets for when they think they can win. The players are less enamored with addressing the sport’s biggest problem, pace of play. And the owners, while instituting pace changes in the minors, tread lightly when it comes to pace to prioritize agreement on major economic issues.
Baseball should look different next year. There is misguided momentum to adopt a “universal DH,” even though half the fans like National League baseball and the homogenization of baseball will have zero effect on attendance and pace and near-zero effect on offense. The difference between the leagues is 346 runs over a full season—one run every seven games. That is an imperceptible change at the cost of diversity, strategy and tradition. (The answer should be to use the DH in all interleague games so American League pitchers never hit.)
You might see the playoffs expand from five teams per league to seven and the wild-card game expand to best-of-three. Less likely is what is needed most: a pitch clock, a limit on pitchers on a roster, a lowering of the top of the strike zone (batting average on fastballs at the top of the zone: .181), and a governor on shifts (lefties hit .216 when they hit a grounder facing a shift, .246 on grounders without one).
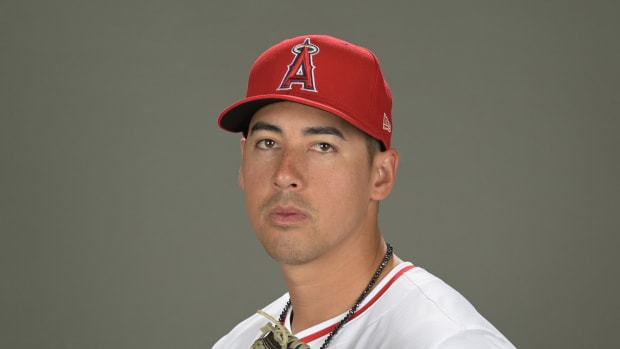
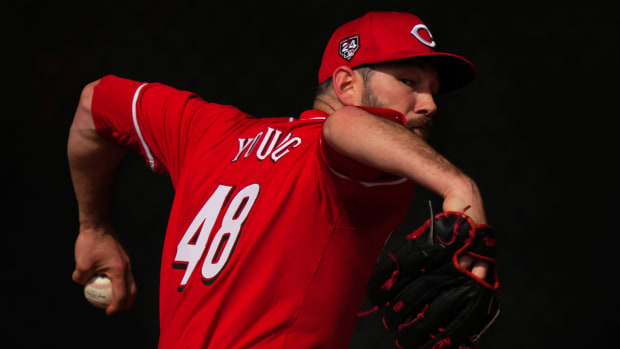
Increased use of dominant relievers like the Braves' Tyler Matzek is slowing down the game.
Greg Nelson/Sports Illustrated
With deep bullpens, baseball games include less action over more time—the inverse of what it takes to compete in a crowded entertainment marketplace. Nothing threatens the game’s place in American culture more than that last sentence. Not the universal DH. Not “marketing” players. Not shifts. It is the growing, yawning gaps of nothingness between balls in play. In a wired, multiplatform world, our retrained eyes and brains crave action—bodies in motion across our screens.
The World Series is baseball’s crown jewel. It is when baseball presents itself to its largest audience, and because of what is at stake, it is also the most extreme version of how baseball has become a long, slow game of keepaway: keep the ball out of play.
Take Game 1 as an example. The Braves and Astros used 11 pitchers. It took four hours, nine minutes to play a nine-inning game in which the first batter, Jorge Soler, hit a home run and the lead never changed. A ball was put in play once every four minutes, 54 seconds.
In 1952 the avant-garde composer John Cage “wrote” a composition in protest of Muzak and industrial noise in postwar America. Called 4’33”, it was four minutes, 33 seconds of silence. Who knew a World Series game would offer even longer compositions of nothingness?
Like Kudzu, the growth of bullpenning has grown astonishingly fast. Comparing the past five World Series (2017-21) to the five just before (2012-16), nine-inning games now:
- Take 11 minutes, 54 seconds longer to play.
- Include 14% more pitchers (from 8.8 per nine to 10.1).
- Have 7% fewer balls in play.
- Take 13% longer for a ball to be put in play (from 4:13 to 4:46).
It’s not the number of pitches. In five-year increments, that number has gone up, down and up, and never by a variance of more than 11.
Every pitching change adds an average of 8 ½ minutes to a game. Relief pitchers throw harder, they throw pitches that are harder to hit, and they take more time between pitches because they need the recovery from maxing out on every pitch.
Some key markers of the 2021 World Series:
- Over 54 innings, there were only two lead changes.
- Both teams used at least five pitchers in five of the six games.
- That’s more nine-inning World Series games this year with each team using five or more pitchers than every World Series combined from 1903-2001.
- Batters hit .207 over innings five through nine, the worst such offensive output in any non-sweep in at least the past 14 World Series.
- It is not just reliever velocity that is killing offense in the second half of games. It is spin. There were more breaking pitches in innings five through nine in this World Series than in any one since 2008, when such records are available. Pitchers threw 44% breaking pitches after the fourth inning. Batters hit .187 against them.
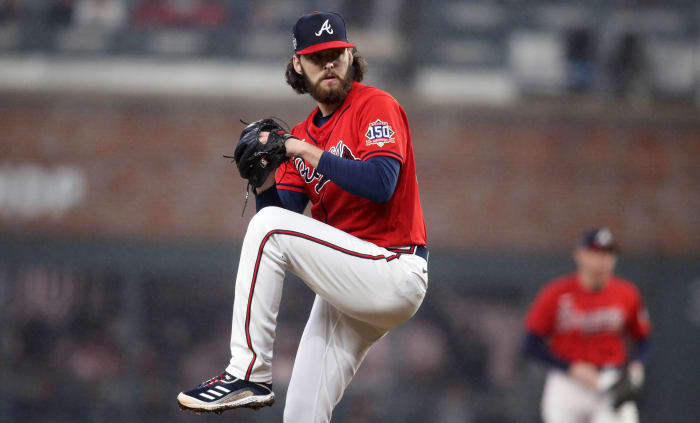
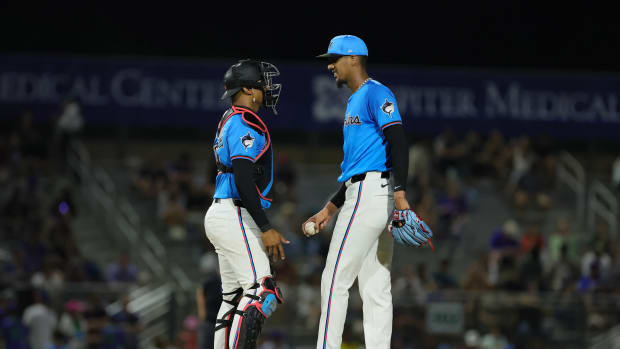
Despite having a 76-pitch no-hitter, Atlanta pulled Ian Anderson after five innings in Game 3 of the World Series.
Brett Davis/USA TODAY Sports
The decisions to pull a dominant Blake Snell in 2020 and a dominant Ian Anderson in 2021 after facing just 18 batters each caused controversy. But they are just the most noticeable examples of what have become common occurrences: Relief pitching is so good and so deep managers want to go to their bullpens early and often.
Below is a look at the correlation between bullpens and balls in play in the World Series. The more pitchers are used, the longer the wait to see action:
| Time (Hours and Minutes) | Pitchers | BIP | Min. Per BIP | |
|---|---|---|---|---|
2017–2021 | 3:42 | 10.06 | 46.3 | 4:46 |
2012–2016 | 3:29 | 8.84 | 49.6 | 4:13 |
2007–2011 | 3:32 | 9.06 | 50.3 | 4:13 |
2002–2006 | 3:23 | 7.86 | 53.2 | 3:48 |
Baseball ebbs and flows. But in this case, because the industry has learned well how to develop throwers (an activity that begins as static; hitting is reactionary, thus harder to teach) the supply of relief pitching is not going to dwindle. The correlation in the above chart between more pitchers and less action in the game’s jewel event is likely to worsen unless baseball puts a thumb on the scale to rebalance offense and defense.
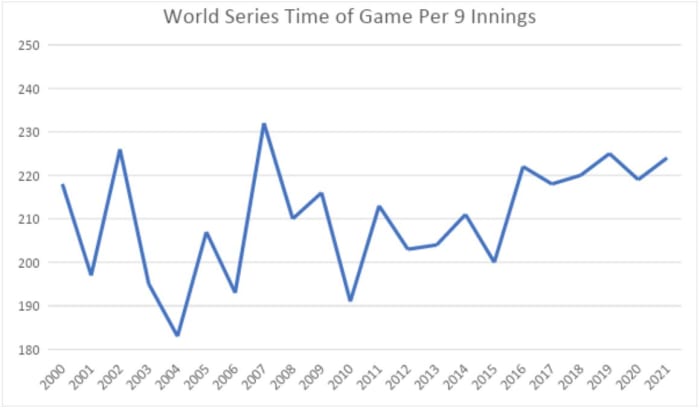
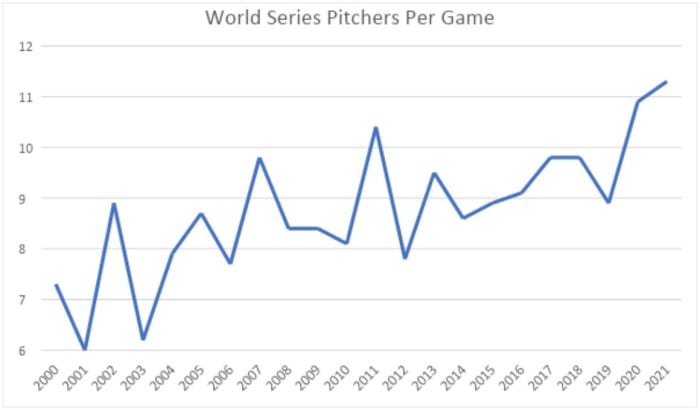
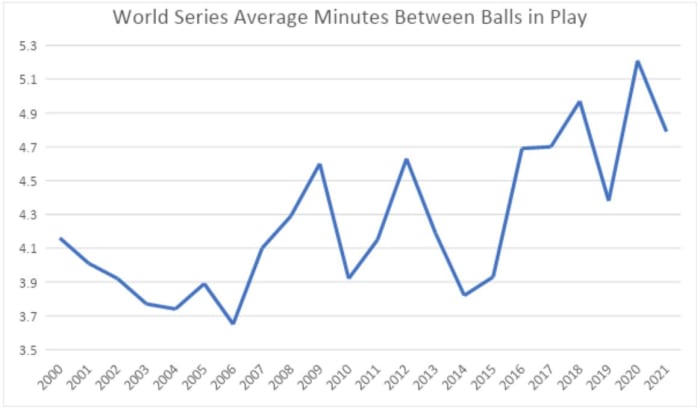
Here is the changing look of the World Series on an annual basis. Note the extreme upward shifts toward inaction in the past five years in each case.
More MLB Coverage:
• Rankings and Predictions for MLB's Top 50 Free Agents
• Buster Posey Never Wanted the Attention He Deserves
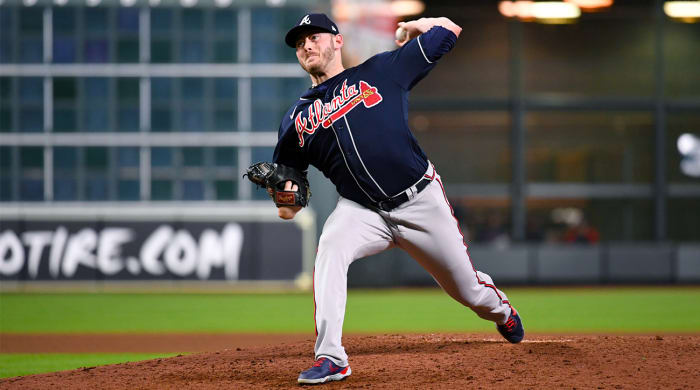
• Max Fried Finds Another Level to Win One for the Braves and Starters Everywhere
• Astros Couldn't Silence the Naysayers—and Never Will