By The Numbers: Measuring the defensive prowess of five teams

In the weeks leading up to the 2010-11 season, one of the preview pieces I worked on was a list of the game's 16 biggest "Impact Defenders." Some of the rankings were based on my opinion from watching the previous year's games, some were based on input I solicited from scouts and coaches, and some were based on tempo-free statistics for rebounds, blocks and steals. It was a fun list to compile, and Florida State's Chris Singleton was my choice at No. 1, but the level of subjectivity bothered me.
If you read my weekly Power Rankings, you know I'm obsessed with analytics. I could not get over the fact that in 2010, we had a very deep understanding of players' offensive value -- through sites like kenpom.com and services such as Synergy -- but no definitive and comprehensive data on individual defense. We could try to extrapolate things from box score stats, or from Synergy's defensive logging, but it would only yield partial strands of defensive DNA. The tempo-free offensive rating (ORating) system that statistician Dean Oliver proposed in his 2003 book Basketball on Paper is widely in use, because it can be calculated from standard play-by-play data, but his defensive rating (DRating) formula never caught on, because compiling it accurately would require deep film review of games.
This would take an immense amount of time to track on a national level. Every basket would have to be analyzed to see where a defense broke down -- maybe a man was scored on straight-up, but maybe the points were the result of a bad rotation one pass earlier, or a bad hedge on a pick-and-roll -- so blame could be assigned accordingly. Defense being a collective endeavor, the blame could be shared between 2-3 players on any given possession. So could the credit: If a perimeter player harries his man into an off-balance shot, and a help defender steps over for an easy block, they should each receive half of a forced miss; if two players trap a ballhander and he's whistled for a travel, they should receive half of a forced turnover. More importantly, steals couldn't be the only turnovers charted. Players would need credit for drawing offensive fouls, whether by taking charges or running into moving screens; and they need credit for forcing errant passes, double-dribbles, travels, five-second calls or smothering someone at the end of a shot clock. The player that disrupts a pass or a drive needs credit for the turnover forced, not the player who scoops up the ball once it's been knocked away. The current box-score model, which lacks many of the elements that go into defensive stops, is woefully inadequate.
This offseason, my goal was to reach at least some level of defensive enlightenment through film review. To assist with a project for SI's preview issue, I enlisted David Hess, a writer for TeamRankings.com who had charted a number of Kansas Jayhawks games last season (and summarized his findings in my Tourney Blog). We selected five teams, and spent more than 100 hours charting -- all the way down to the level of fractional credit -- every defensive possession from their final 20 games, including the postseason.
For subjects, we chose defending-champ UConn, which held Butler to 18.8 percent shooting in the title game; North Carolina and Ohio State, the two contenders with the majority of their rotations back; Florida State, the most efficient defensive team from last season; and for contrast, Vanderbilt, an offensive power that was undone by its struggles to guard. From our charting, we produced adjusted DRatings for each player, as well as complementary stats covering all aspects of defense -- forcing missed shots, forcing turnovers, creating free throws and grabbing defensive boards. I talked to coaches and players to put our aggregate data in context with teams' defensive philosophies and personnel, and then wrote the 10-page feature that appears in this week's SI. It's available online in a stripped-down form, but is best digested in print or on the iPad.)
I've covered college basketball for seven seasons, and I count this project as my biggest learning experience. Watching games through a defensive prism can be revelatory, and the study data gave us concrete -- rather than anecdotal -- information about the skills of individual defenders. As a companion to the magazine piece, these are my five biggest takeaways from the study*:
(*A guide to understanding this stuff: DRating is essentially the answer the question, "If Player X were on the floor for 100 possessions, engaging in his normal rate of plays, how many points would his TEAM yield?" The lower a DRating is, the better. Because defense is a team concept, a player's DRating is largely based on team performance. So, if a player's DPoss% [the portion of plays he directly engages in] is 20.0, then 20 percent of his DRating would be based on those plays alone, and 80 percent would be based on the team's overall defensive performance.
In any given game, we had to assign credit/blame for a number of misses/baskets to the "team" as a whole, such as wide-open misses, or points scored on solo-runout fastbreaks, or putback points where one player can't be blamed for a missed boxout. All of those "team" possessions needed to be factored into DRatings, as well as the team's overall performance. DRatings should be assessed only within the context of a team, not across teams, and small variations should be viewed as significant -- i.e., a player whose DRating is much better than team's overall rating should be considered a great defender, and the few players whose DRatings are lower than their team's should be considered liabilities.
Moving on to the categorical stats: Stop% is the percentage of possessions the player engaged in that ended in stops. OppFG% is the player's forced misses divided by the baskets for which he was blamed. OppTO% is the turnovers the player forced divided by the possessions he directly engaged in. FTRate is the free-throw attempts the player created divided by the field-goal attempts that he faced.)
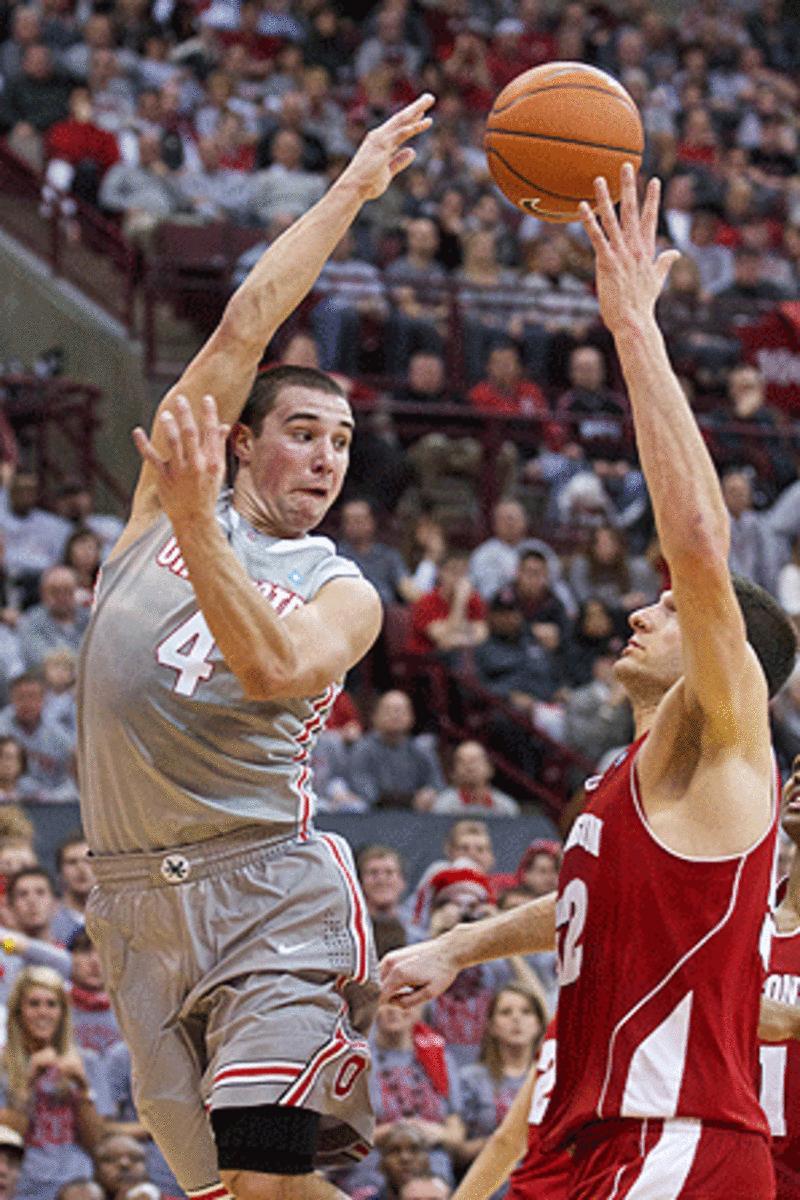
1. Ohio State's Aaron Craft is the king of turnover creation. One of the biggest failings of box scores is the inability to assess forced turnovers. Box scores often mis-credit steals, and don't track who forced other takeaways. There are two ways to look at turnover creation, the first being OppTO%, and among the players studied, Craft (32.94) was the only one to break the 30 percent mark. These were the top five in OppTO% (min. 10 min./game played):
Another option is to take DPoss% out of the equation and just look at the ratio of turnovers created versus possessions played. The figure here shows the percentage of possesions, when he is on the floor, in which a player created a turnover. Again, Craft led this by a wide margin (min. 10 min./game played):
It was not surprising, then, that Craft finished as the No. 1 defender on Ohio State, even ahead of former Big Ten Defensive Player of the Year David Lighty:
OHIO STATE TEAM TOTALS
Team Adjusted Rating (Including Unforced Misses & TOs, Team-Blamed Baskets): 89.7
2. Florida State's Bernard James needs to be considered one of the country's biggest defensive forces. He credits coach Leonard Hamilton's principles for the Seminoles being the nation's most efficient defensive team for two years running, saying, "You could take a team of D-II players, teach them our principles, and have them lead the nation in defense." But my guess is that the 6-foot-11 senior's shot-blocking and shot-challenging skills have a lot to do with it. He recorded a stunning amount of "blind" blocks (coming from outside a shooter's field of vision) as a help defender, and had the lowest OppFG% in the study, at 27.3.
In our charting of Florida State, James actually came in ahead of Singleton, who had a much bigger rep. Singleton was the great gambler in FSU's D (associate head coach Stan Jones called Singleton's approach a "rum-runner" mentality), whereas James was the reliable basket protector:
FLORIDA STATE TEAM TOTALS
Team Adjusted Rating (Including Unforced Misses & TOs, Team-Blamed Baskets): 87.1
3. Kemba Walker was more well-rounded than anyone realized. He was UConn's offensive hero, but would you believe he was also the Huskies' best defender over the final 20-game stretch? Coach Jim Calhoun believes Walker didn't get enough credit for being a "disruptive" force on D, and we agree; he created a significant amount of turnovers without fouling, and was quick enough to give middle-help and still challenge shots on the wings. Before you anoint UConn a Final Four team for 2011-12, consider the void Walker leaves on both ends of the floor:
UCONN TEAM TOTALS
Team Adjusted Rating (Including Unforced Misses & TOs, Team-Blamed Baskets): 89.4
4. On the bright side ... freshmen Jeremy Lamb and Roscoe Smith hit their defensive peaks in the NCAA tournament, which bodes well for them serving as sophomore stoppers. Examine their splits from the nine regular-season games, five Big East tournament games, and six NCAA tournament games, and you'll see significant improvement as they get deeper into the title run:
5. North Carolina has two excellent interior defenders, not just one. John Henson was the ACC's Defensive Player of the Year, and had the best DRating of any Tar Heel in SI's study, but Tyler Zeller ranked second on the team -- and according to coach Roy Williams' internal charting system (which uses pluses and minuses on every possession), Zeller is the most reliable positional defender. Henson wants to call the duo "Fire and Ice," because he makes the more stinging defensive plays (blocks), Zeller takes plenty of charges and is adept at tipping away post entries -- neither of which show up in the box score.
NORTH CAROLINA TEAM TOTALS
Team Adjusted Rating (Including Unforced Misses & TOs, Team-Blamed Baskets): 89.5
To see what happens when a team only has one reliable interior defender -- and he's only on the floor for 25 minutes per game -- look no further than Vanderbilt, which was a five-seed in the NCAA tournament, but had the least-efficient defense of any major-conference team in the bracket. Senior center Festus Ezeli ranked as the Commodores' best defender, engaging in 27.5 percent of possessions, with an OppFG% of 31.0. The drop-off between him and his backup, Steve Tchiengang, was immense: He allowed opponents to shoot 44.4 percent, fouled much more frequently, and had a DRating more than three points worse, which represents a major gap. Vanderbilt's biggest key, aside from getting high-scoring guards Brad Tinsley and John Jenkins to defend at a respectable level, is shoring up the middle.
VANDERBILT TEAM TOTALS
Team Adjusted Rating (Including Unforced Misses & TOs, Team-Blamed Baskets): 98.9