Analytics Recap: Kansas City Chiefs Defeat Cleveland Browns 22-17
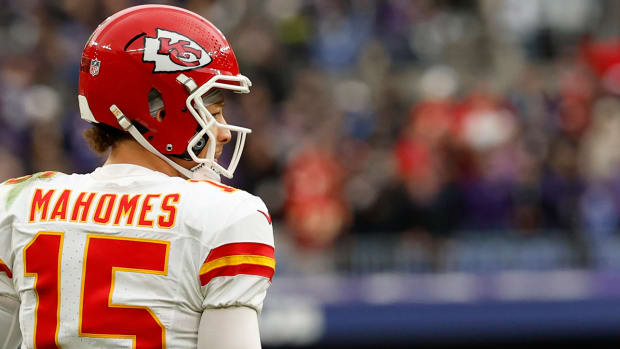
The Kansas City Chiefs have moved on to their third consecutive AFC Championship Game after defeating Baker Mayfield and the Cleveland Browns 22-17 on Sunday. The big storyline of the game was Patrick Mahomes being forced out of the game in the third quarter and entering the concussion protocol as the Chiefs led the game 19-10. Things after that got really uncomfortable, but thankfully, Chad Henne and Andy Reid came up huge to save the Chiefs' season and Super Bowl repeat hopes.
This Sunday at 5:40 p.m. Arrowhead Time, the Chiefs will face the Buffalo Bills for the right to go to Tampa Bay for Super Bowl LV on February 7 where they would face the winner of the NFC Championship Game between the Green Bay Packers and Tampa Bay Buccaneers. For Chiefs vs. Bills, it is likely that two of the three quarterbacks on the AP All-Pro teams will face off, with the Chiefs being represented by Mahomes and Bills being represented by Josh Allen.
Here are the advanced numbers from the Chiefs' win over the Browns from Ben Baldwin's rbsdm.com.
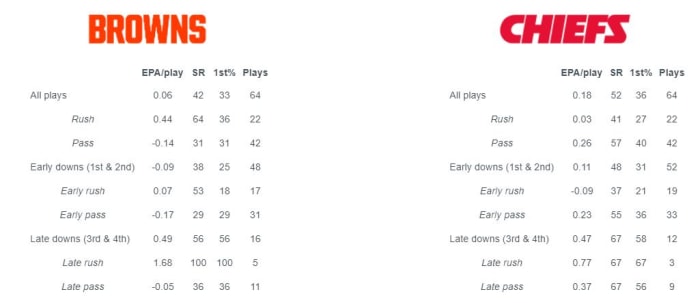
EPA = Expected Points Added, SR = Success Rate, 1st% = First Down Rate
The Chiefs offense did a great job in this one, earning 0.18 EPA per play on all plays, 0.23 EPA per pass on early downs and 0.47 EPA per play on late downs. Just all-around great offensive production from Andy Reid's team. For the Browns, their run game was extremely effective, but it still didn't mean much, as they only put up 19 points in the game due to some major mistakes, mostly from their receivers and offensive line.
The Browns' running back duo really came to play in the run game, with Nick Chubb and Kareem Hunt having 2.3 and 3.3 Rush EPA respectively, though Chubb made it all for naught with -2.7 EPA in his passing targets. The big-time player for the Browns, though, was David Njoku, who got 4.5 EPA on the game over his six targets. The big disappointment for the Browns was Jarvis Landry, who finished the game with -7.3 EPA and only two successful plays on his 11 targets.
For the Chiefs, Tyreek Hill and Travis Kelce were tremendous, having 6.8 EPA over 14 touches and 5.2 EPA over 11 touches respectively. Joining them for good performances was Mecole Hardman, who had 3.3 EPA over his five touches, and Darrel Williams with 1.9 EPA over his 19 touches.
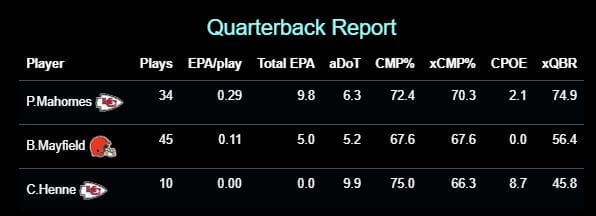
aDoT = Average Depth of Target, CMP% = Completion Percentage, xCMP% = Expected Completion Percentage, CPOE = Completion Percentage Over Expectation (Completion Percentage minus Expected Completion Percentage), xQBR = ESPN's Quarterback Rating metric
Patrick Mahomes had an impressive game with a high-level 0.29 EPA per play, 6.3 aDoT 2.1 CPOE and 74.9 QBR, but I'd like to focus this more on Baker Mayfield. You may have noticed that EPA on the previous image and this image are very different for Mayfield, and there is a good explanation for this. The EPA on this image is excusing Mayfield for wide receiver fumbles, and of course, the Browns had a fumble on a 25-yard completion to Rashard Higgins to the one-yard line that was then fumbled through the end zone to give the Chiefs the ball. This play cost Mayfield 4.4 EPA and certainly more when accounting for what he would have received from this play had the fumble not happened. Mayfield's numbers also should have been much higher than the 5.0 EPA had the Browns receivers not dropped three passes, including some chances for big yardage.
The biggest plays of the game, both -4.4 EPA for the Browns offense, were Tyrann Mathieu's interception of Baker Mayfield on the first drive of the third quarter and the Rashard Higgins fumble that went through the end zone for a touchback that gave the Chiefs the ball. All of the following six biggest plays came from the Chiefs offense, with four positive ones and two negative ones. The negative ones were Chad Henne's interception midway through the fourth quarter (-3.6 EPA) and Harrison Butker's missed 33-yard field goal that could have given them a three-score lead in the third quarter (-3.2 EPA). The positive ones were Patrick Mahomes' 20-yard touchdown pass to Travis Kelce to take a 13-3 lead (3.4 EPA), Mahomes' jet sweep touch pass to Mecole Hardman which he took 42 yards (2.9 EPA), Darrel Williams' 12-yard run on the 4th-and-inches following Mahomes' injury (2.9 EPA) and Henne's 24-yard pass to Kelce on 3rd-and-5 to get them deep in Browns' territory before Henne's interception (2.6).
Moving onto the win probability chart, we can see that the Chiefs had the win probability advantage for the entirety of the game. They started the game with a 75.1% win probability and it hit a game-low 72.8% win probability with 4:58 remaining in the first quarter. The Chiefs entered the second quarter with an 84.9% win probability and went into halftime with a 95.9% win probability. When Patrick Mahomes was injured with 7:44 remaining in the third quarter, the Chiefs' win probability stood at 92.2% and the Chiefs finished the third quarter with a 91.4% win probability. In the fourth quarter, their win probability dropped to as low as 76.8% with 5:17 remaining, but they were able to hold on at the end thanks to Chad Henne and Andy Reid's heroics.
For NFL Team Tiers by Offensive and Defensive EPA per play, the top team is the Packers with the top offense (0.270 EPA per offensive play) and the eighth-ranked defense (0.011 EPA allowed per defensive play). Following them in a pretty even race are the Chiefs (second-ranked offense at 0.246 EPA per offensive play and 19th-ranked defense at 0.060 EPA allowed per defensive play) and the Bills (third-ranked offense at 0.202 EPA per offensive play and seventh-ranked defense at -0.001 EPA allowed per defensive play). The next tier includes the fourth championship game team, the Buccaneers, with the fifth-ranked offense (0.167 EPA per offensive play) and ninth-ranked defense (0.015 EPA allowed per defensive play).
The top four teams in EPA per play tiers this year are the final four teams alive in this NFL season, including the team who didn't win their own division (Tampa Bay) behind a team ranked eighth in this chart (the New Orleans Saints).
Moving on to early-down passing rate, there are some very interesting numbers here. All of the remaining four teams are in the top 10 in both early-down passing rate and early-down EPA per pass. The Chiefs are third in early-down passing rate (62.4%) and third in early-down EPA per pass (0.297), the Bills are first in early-down passing rate (63.3%) and seventh in early-down EPA per pass (0.237), the Buccaneers are eighth in early-down passing rate (55.7%) and ninth in early-down EPA per pass (0.202) and the Packers are ninth in early-down passing rate (55.2%) and first in early-down EPA per pass (0.360).
The other two teams who were in the top 10 in both, teams who got the rough deal here, were the Houston Texans (second in pass rate, sixth in EPA per pass) and the Miami Dolphins (seventh in pass rate, fourth in EPA per pass).
Through the divisional round of the 2020-21 NFL Playoffs, Patrick Mahomes is currently second in EPA+CPOE composite score (0.190) with a 0.350 EPA per play (second-highest) and 3.3 CPOE (seventh-highest). Ahead of him is Aaron Rodgers with a 0.237 EPA+CPOE composite score, 0.455 EPA per play and 6.3 CPOE, and just behind him is Josh Allen with a 0.189 EPA+CPOE composite score, 0.295 EPA per play (fifth) and 6.3 CPOE (tied for first). The final conference championship quarterback, Tom Brady, ranks fifth in EPA+CPOE composite score (0.172), fourth in EPA per play (0.308) and 11th in CPOE (2.5).
For just the divisional round, the top quarterback in EPA+CPOE composite score was Patrick Mahomes with a 0.217 composite score, with 0.398 EPA per play and 5.6 CPOE. Right behind Mahomes was Aaron Rodgers with a 0.207 composite score. Rodgers had the EPA per play advantage on Mahomes with a 0.431, but Rodgers' CPOE of 2.0 put him just behind Mahomes in the composite score. Following them to complete the top five quarterbacks of the week were Jared Goff (0.200 composite score, 0.159 EPA/play and 17.6 CPOE), Baker Mayfield (0.158 composite score, 0.221 EPA/play and 5.7 CPOE) and Tom Brady (0.044 composite score, 0.152 EPA/play and -10.3 CPOE).
For more Kansas City Chiefs analytics and analysis, follow @SIChiefs and @WichitaChiefSam on Twitter.


