Scoring and long ball back during 1st week of MLB season

NEW YORK (AP) The long ball is back.
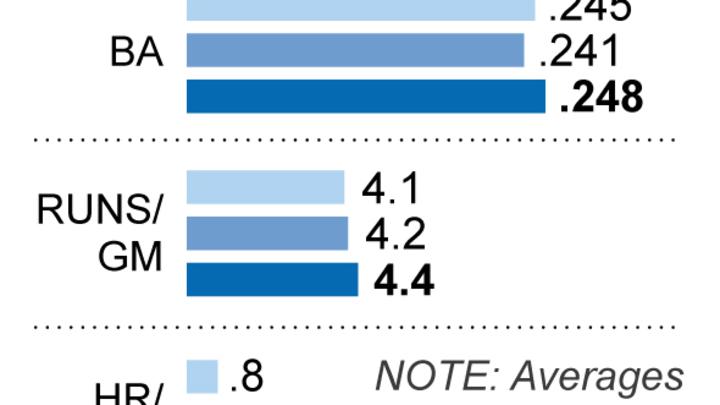
Teams averaged 1.14 home runs per game through the first week of the season, according to STATS LLC. That is up nearly 26 percent from last year's average through the first eight days and the most since 1.20 in 2006.
''It is a little surprising, particularly early in April, the runs that are being scored,'' Boston Red Sox manager John Farrell said Monday.
Teams averaged 4.43 runs per game. That marked a 6 percent increase through the same period last season and the highest opening-week average since 2011.
Miami's Dee Gordon, the reigning NL batting champion, points to Colorado rookie Trevor Story, who hit a record seven home runs in his first six games, and San Diego's Matt Kemp, whose 10 RBIs were two behind Story's major league-leading total.
''Trevor Story and Matt Kemp have been holding it down for us. So, we appreciate them guys,'' Gordon said, before adding there is most of the season to be played. ''You could be hitting .800 now and hit .220 at the end of the year.''
Scoring remains down significantly from the height of the Steroids Era. The average during the first full week peaked in 2000 at 5.34 runs per team each game.
Still, it's far above the recent low of 4.05 two years ago.
''We are dealing with a small sample,'' Commissioner Rob Manfred said. ''With that caveat, my preliminary thought is that we are seeing part of a natural cycle in the game.''
The big league batting average of .248 was up seven percentage points from last year and the highest during the first full week since 2013.
''I don't think we're far enough into it to see a real trend,'' Baltimore manager Buck Showalter said. ''But things have a way of correcting themselves in our game - like the shifts and all the other stuff. Usually offenses adjust, and the defense and pitchers make another adjustment. It's a constant game of adjustments.''
The increased batting average came despite another big jump in defensive shifts. There were 1,089 through Sunday, according to Baseball Info Solutions, up nearly 57 percent from 694 through the opening week last year. There were just 484 during a similar period in 2014 and 212 in 2013.
''You don't remember the ones that you take away,'' Atlanta catcher A.J. Pierzynski said. ''It always seems like you remember the ones that you give up, where you're shifting on a guy in the hole, and the guy hits a ball where the shortstop has been standing for 150 years.''
After declining for much of a 15-year stretch that coincided with the start of drug testing, more low strikes being called and an increase in defensive shifts, offense started rebounding during the second half of last season. The average number of runs per team each game climbed 9 percent in the second half, from 4.1 to 4.46, and home runs increased nearly 16 percent, from .95 to 1.1.
''I think there's just an influx of new young players that are in the league as well as some guys that have been around that now have a little bit more experience,'' Chicago White Sox manager Robin Ventura said. ''You're starting to see a little changing of the guard of what was there before to what's there now, and some of those guys are power hitters.''
Marlins outfielder Christian Yelich knows trends can change over the course of a six-month season.
''You never know, there could be three no-hitters next week and you'll be asking me different questions,'' he said.
---
AP Baseball Writer Mike Fitzpatrick, AP Sports Writers Dave Campbell and Kyle Hightower, and AP freelance writer Ian Quillen contributed to this report.
