Matchup madness means more relievers, longer games

CHICAGO (AP) Managers head to the mound and point to the bullpens so often in the postseason, it wouldn't be surprising if they need Tommy John surgery.
Complete games have gone the way of spittoons, flannel uniforms and pregame infield practice.
An average of 9.32 pitchers were used in this year's postseason games heading into the World Series, according to the Elias Sports Bureau, up from 8.16 in the 1996 and 5.70 in 1986.
Matchup madness rules.
''A lot of it is just to protect your butt, that somebody else might have the information, so I better make sure that I make the move that they know I should be making instead of the move that I know I should be making,'' former big league manager Bobby Valentine said.
All those pitching changes contribute to World Series games turning into the late, late show.
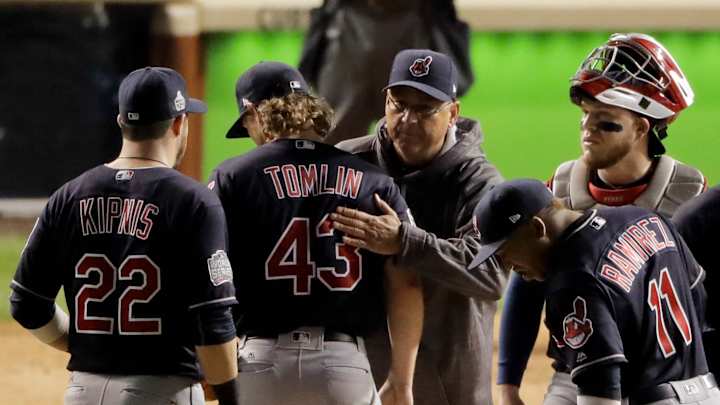
After using a relative restrained three pitchers to win the opener 6-0, Cleveland sent seven to the mound for a 5-1 loss to the Chicago Cubs in Game 2, and they needed 196 pitches to get 27 outs. The nine innings took 4 hours, 4 minutes to play.
Through the league championship series, nine-inning postseason games averaged 3:22, up from 3:14 last year. The first four games of this year's World Series averaged 3:38.
Much of that time has been for trips to the mound.
''In the past you were looking for five really good starters. That's always your focal point,'' Toronto manager John Gibbons said. ''Things have definitely changed but you can go back the last couple of years and look at the Royals, and the big talk was how they had those three guys late, actually four guys. The starter would go five or six innings and they would just turn it over to those guys. A lot of teams are trying to do the same.''
Back in the 1976 regular season, games averaged 4.83 pitchers, according to Elias. The figure rose to 5.59 by 1986, 6.88 a decade later, 7.70 in 2006 and 8.30 this year.
Decades ago, aces were expected to finish what they started. San Diego's Randy Jones led the major leagues with 25 complete games in 1976 and Detroit's Mark Fidrych had 24.
This year, Chris Sale of the Chicago White Sox topped the big leagues with six complete games and San Francisco's Johnny Cueto was second with five.
Data has revolutionized the sport. When he was managing in the New York Yankees minor league system in the 1980s, Buck Showalter had his wife hand-write spray charts to show where opponents hit balls. Angela Showalter can now relax while watching her husband manage the Baltimore Orioles.
Just before the start of this season, Major League Baseball reached a deal with Apple to have iPad Pros in dugouts, and managers have instant access to figures tracking the decline of starting pitchers' effectiveness the third time through the batting order.
''Every manager would like their starter to go complete-game shutout, but I think that there's a certain point in the game where the starting pitcher is not being as effective, and you have other options,'' Los Angeles Dodgers manager Dave Roberts said. ''When you look at analytics or data, those are facts. So where certain options have shown better, then as manager it only makes sense to trust that information as well as your eyes.''
When they had Aroldis Chapman, Andrew Miller and Dellin Betances in his bullpen this season, the New York Yankees were confident any time they led after six innings. With relievers so prized, the Yankees dealt Chapman to the Cubs and Miller to the Indians for prized prospects.
Cleveland manager Terry Francona has used Miller in the middle of games to shut down opponents.
''Right now matchups are en vogue, there is no question,'' Cubs manager Joe Maddon said. ''They've been getting more and more that way over the last couple years.''
---
AP Sports Writer Beth Harris and AP freelance writer Ian Harrison contributed to this report.
