%20%20--%3E%0A%3Csvg%20version%3D%221.1%22%20id%3D%22Layer_1%22%20xmlns%3D%22http%3A%2F%2Fwww.w3.org%2F2000%2Fsvg%22%20xmlns%3Axlink%3D%22http%3A%2F%2Fwww.w3.org%2F1999%2Fxlink%22%20x%3D%220px%22%20y%3D%220px%22%0A%09%20width%3D%2239px%22%20height%3D%2240px%22%20viewBox%3D%220%200%2039%2040%22%20enable-background%3D%22new%200%200%2039%2040%22%20xml%3Aspace%3D%22preserve%22%3E%0A%3Cpath%20fill%3D%22%23FFFFFF%22%20d%3D%22M38.5%2C7H28.2v26h10.3V7z%22%2F%3E%0A%3Cpath%20fill-rule%3D%22evenodd%22%20clip-rule%3D%22evenodd%22%20fill%3D%22%23FFFFFF%22%20d%3D%22M26.1%2C25.5c0%2C5.8-4.1%2C7.5-12.9%2C7.5C3.9%2C33%2C0%2C31.2%2C0%2C25.2v-1.1h11.6%0A%09v2.4c0%2C0.7%2C0.1%2C1.4%2C1.2%2C1.4c1%2C0%2C1.2-0.4%2C1.2-1.3v-0.9c0-1.6-0.9-1.6-3.5-2.2C2.2%2C21.7%2C0%2C19.7%2C0%2C15.3v-0.9C0%2C9.3%2C5.5%2C7%2C12.9%2C7%0A%09c10.2%2C0%2C12.8%2C2.6%2C12.8%2C7.4v1.8h-11v-2.9c0-0.6-0.4-1.1-1.2-1.1c-0.6%2C0-1.2%2C0.4-1.2%2C1.1v0.9c0%2C1.5%2C0.9%2C2%2C3.3%2C2.5%0A%09c8%2C1.6%2C10.5%2C3.3%2C10.5%2C7.5V25.5z%22%2F%3E%0A%3C%2Fsvg%3E%0A)
My heavens: Angels as favorites to win the World Series?

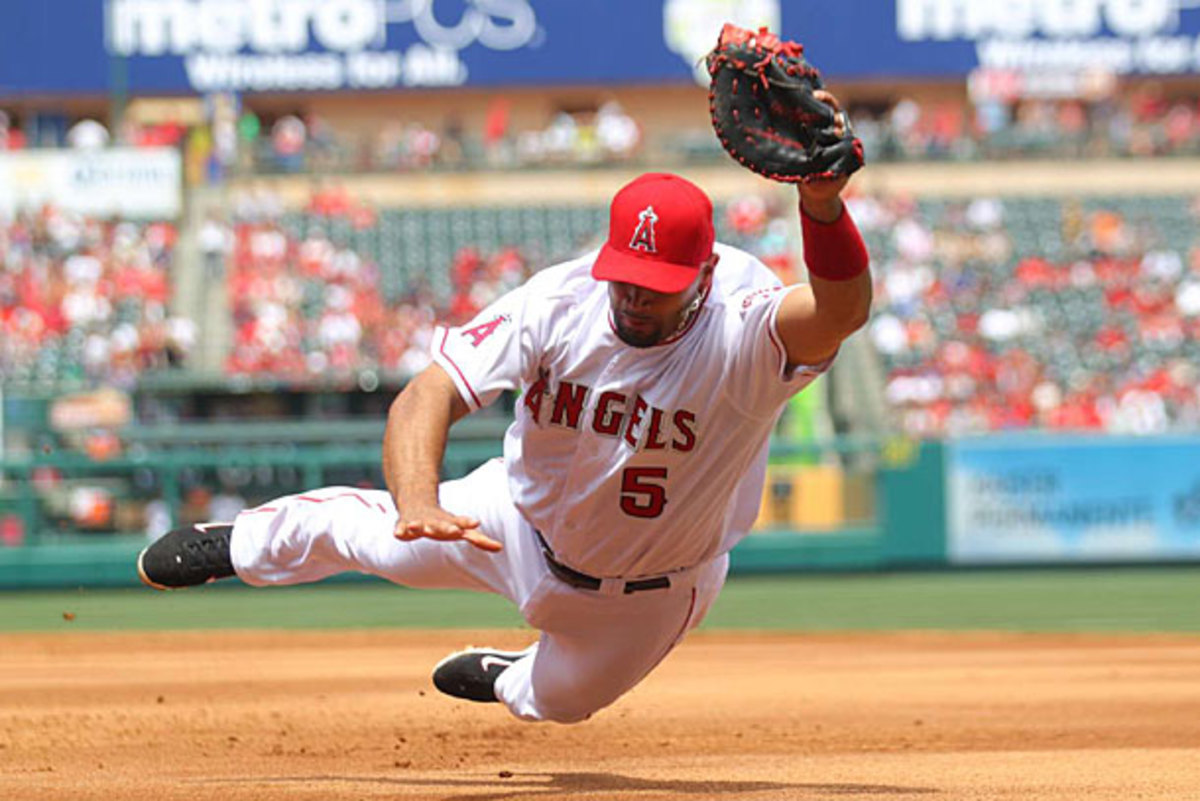
Albert Pujols and the Angels are looking to grab their first World Series title in 11 years this season. (Jed Jacobsohn/SI)
By Jay Jaffe
The 2013 season is already over and the winner is… the Angels over the Nationals in the World Series. If that somehow doesn't ring a bell, that's because it's the estimation by the PredictionMachine.com website in its 2013 season preview. The site's "Predictalator" played the entire season out 50,000 times using a simulation that claims to account for "all of the relevant statistical interactions of the players (playing or not playing/injured), coaches, officials, fans (homefield advantage) and weather in each game." Via that process, the Predictalator had the Angels winning 12 percent of the time, followed by the Tigers and Nationals (10 percent apiece), Reds (nine percent), Dodgers (eight percent), Rays and Giants (seven percent apiece).
The site, which apparently offers a subscription service aimed at bettors, is a bit light on the specifics of what elevated the Halos ahead of the rest of the AL pack:
The Los Angeles Angels may have lost ace pitchers Dan Haren, Zack Greinke and Ervin Santana, but they may be even better this year with former Rangers star Josh Hamilton in one of the best lineups we have ever seen. Otherwise, the Angels still have solid depth in the rotation, an improved bullpen and the benefit of the worst team in baseball (Houston) being added to the division. Even with notable offseason upgrades and setbacks occurring for almost all of the elite teams in baseball, the Toronto Blue Jays rank just eighth overall in World Series title chances. Teams that have been building over the last couple of years, like the Washington Nationals, Cincinnati Reds and Los Angeles Dodgers may benefit the most from the wide open MLB race.
A closer look at the process touted by PredictionMachine notes, "In general, we apply ballpark and level-adjusted, relevant statistics from every game a player has played in his professional career to a fairly traditional player development curve that considers age and previous playing time," which sets average inputs as well as variance based upon player health. "We have done our best to estimate playing time for all players who are expected to see significant starting time in 2013. That being said, some gaps have been filled in by our best approximations of average bench and role players on teams."
Via those estimates, PredictionMachine forecasts the Angels for an AL-best 93.3 wins, with a 49 percent chance of winning the division, a 30 percent chance at winning a wild-card spot, a 22 percent chance at a pennant and a 12 percent chance at the World Series. Those 93.3 wins — the result, obviously, of an average from the 50,000 cycles — are 3.6 wins more than any other AL team, and 6.5 more than the Rangers, the second-best team in the AL West according to the simulations.
That gap between the division's top two teams stands out, at least to these eyes, because the more familiar Baseball Prospectus Playoff Odds have the AL West as the majors' tightest division, with the Angels on top but ahead of the Rangers by only an average of 2.3 games over the course of one million simulations. BP's simulations use the site's sophisticated PECOTA forecasting system and manual estimates for playing time to determine team strength but don't make any allowance for managerial tendencies (beyond such estimates, at least), weather or whatever. BP then runs those projections through a Monte Carlo simulation that accounts for the strength of teams via Pythagorean winning percentages (as predicted via runs scored and runs allowed) adjusted for park, league, and quality of opposition.
(I should take this moment to point out that I am still an occasional contributor to Baseball Prospectus and understand their system to a much greater degree than I do PredictionMachine's, hence I'm better able to explain it. That said, I'm not endorsing either as a basis for actual monetary betting.)
BP's odds now include a World Series winning percentage as well, via which the Angels' 9.2 percent chance of winning is still substantial, but lower than those of the Tigers (14.9 percent), Dodgers (11.4 percent), Reds (10.8 percent) and Yankees (9.5 percent); the Nationals (7.6 percent) round out the favorites. BP adjusts those odds as playing time estimates change; unlike PredictionMachine, those assumptions are visible via each team's depth chart page. Without a similar transparency, we don't know what underlies that 93.3-win estimate with regards to, say, Hamilton's transition to Anaheim, Pujols' follow-up to his worst major league season ever, or Mike Trout's historic-level rookie season.
Maybe it's the 374 plate appearances estimated for Vernon Wells (.247/.291/.408) that are dragging them down in BP's sim, but more likely, it's simply a function of variance. The spread on BP's current estimates of wins is lower than that of PredictionMachine, which runs from the Angels (93.3) to the Astros (62.5), a spread of 30.8 wins; by comparison, BP's spread is just 22 wins between the Tigers (89.9 wins) and Astros (67.4 wins). The standard deviation across the population in BP's simulation is lower as well, 5.5 wins compared to 7.7.
The tighter spread is by design, according to BP's head of stats, Colin Wyers:
"[T]he spread of SimW is always going to be tighter than the observed spread, because the observed spread includes things we haven't figured out how to project yet and things that we simply cannot project. So we 'price in' our uncertainty in our forecasts to the playoff odds, which make the odds themselves more useful."
Jay Jaffe is a contributing baseball writer for SI.com and the author of the upcoming book The Cooperstown Casebook on the Baseball Hall of Fame.