Are we witnessing the sequel to 2010's Year of the Pitcher?
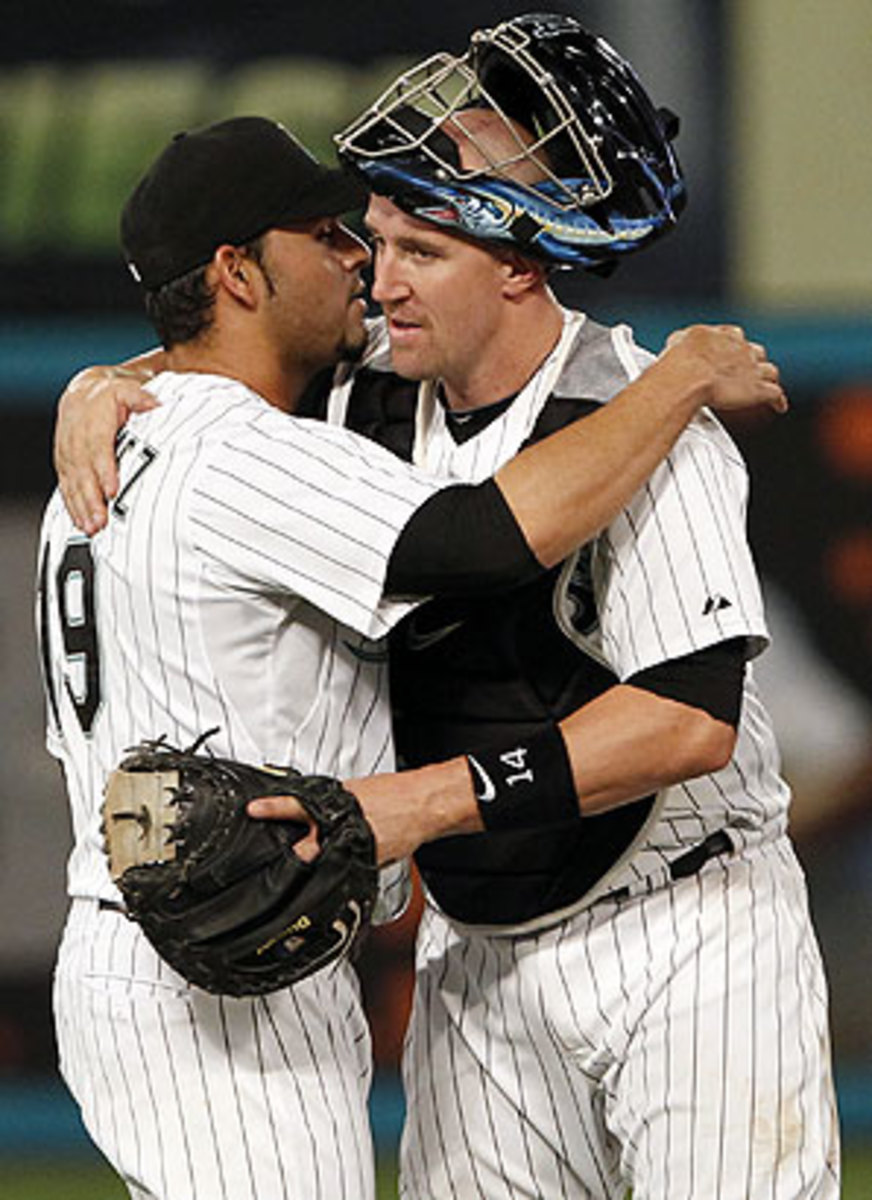
Marlins starter Anibal Sanchez took a no-hitter into the ninth inning on Friday night before giving up a broken-bat single to the Rockies' Dexter Fowler to lead off the inning. The 27-year-old right-hander fell three outs short of becoming the 29th pitcher in history with at least two no-hitters, but the performance was the majors' latest and longest bid for a no-no this season.
Sanchez's start was already the ninth of 11 no-hit starts that have lasted at least five innings in the early stages of 2011. The Tigers' Brad Penny followed suit on Saturday afternoon, and Sanchez's Marlins rotation-mate Josh Johnson carried a no-no into the sixth on Sunday, a staggering third time that he kept his opponent hitless for at least that long in five starts this season.
Last year there were six no-hitters in the regular and post-seasons, but that is just one anecdotal indication of farther-reaching pitching dominance.
Across baseball in the first three and a half weeks of this season, scoring, home runs, walks, batting average, on-base percentage and slugging are all at their lowest per-game rates in nearly two decades, while strikeouts are at their highest rate in that span. Sequels rarely surpass the original, but if what we've already seen of 2011 is any indication, the reprise of the Year of the Pitcher is coming, well, too fast and too furious.
The sample size remains small but is creeping toward significant, with roughly 13 percent of the 2011 season now in the books, and offense is at an alarmingly low level. On Friday morning, for instance, STATS LLC issued a release showing how runs-scoring in March and April this year is at its lowest level (8.62 per game) during the same span since 1992 (8.24). The five lowest-scoring outputs in the season's first month belong to, in order, 1992, 2011, 1993, 2008, 2007 and 2010.
Closer examination by SI.com of offensive production from pre-expansion 1992 (when there were only 26 teams) through 2011 suggests that runs aren't the only victims. By studying the same time period of three and a half weeks -- roughly each season's first 300 games, all of which were played in similar weather conditions in March and April (except for post-strike 1995, which extended into May) -- it becomes apparent that hitters are off to their worst start in every category since at least 1993.
(Notes: Statistics from 2011 are through all games played on Sunday, April 24. Runs-per-game totals vary slightly from the STATS release because different end dates were used so that each year's data pool includes between 300 and 325 games.)
This year's OBP, BB/Game and K/Game are the worst in the recorded period, while average, slugging and HR/Game are all the worst since 1992 or '93.
The data loosely follows a bell curve, starting and ending with light offense but reaching the height of the Steroid Era in between. The three seasons that stand out the most are 1992, the last season before pitching was diluted by expansion to 28 teams; 2000, the era's most prolific offensive season; and now 2011, which is starting to look like the Year of the Pitcher II.
But it's unlikely that the cause of the recent downward slope of offense is only PED testing-related; pitchers seem to be getting better, or at least more confident, too.
Here are six theories on why pitchers have the upper hand.
1) Hitters in the testing era are not as strong or prolific as long believed. Obviously many pitchers were using performance-enhancing drugs, too, but it would seem that offensive power has suffered the most -- or at least pitchers that have benefited the most by changing their approach.
Without the rampant power and comical home run totals of the Steroid Era, pitchers seem more willing to stay inside the strike zone and challenge hitters. As a result, walks are down and strikeouts are up.
2) Defense has become cool again. Much as OBP was the undervalued-turned-exploited statistic used in team-building in the 1990s, defensive metrics have been in vogue for the past five to 10 years. The Rays are one example of a club successfully rebuilding by emphasizing run prevention through good pitching and athletic defenders. Additionally, new defensive stats -- Ultimate Zone Rating, Plus/Minus and Park-Adjusted Defensive Efficiency, to name three -- are helping front offices better identify which players are actually good fielders instead of just having the reputation for being good fielders.
3) Ballpark construction is beginning to favor pitchers again, or at least not so blatantly favor hitters. The group of stadiums built throughout most of the 1990s -- U.S. Cellular Field (1991), Camden Yards (1992), Progressive Field (1994), Rangers Ballpark in Arlington (1994), Coors Field (1995), Turner Field (1996) and Chase Field (1998) -- is largely a who's who of offensive havens, except for Turner and perhaps Progressive Field.
Beginning with the construction of Seattle's Safeco Field, which opened in 1999, there's been more balance in terms of whether the new parks favor hitting or pitching. There are some true homer-happy bandboxes, such as Cincinnati's Great American Ballpark (2003), Philadelphia's Citizens Bank Park (2004) and new Yankee Stadium (2009). But there are also some of the game's great pitchers' parks, including Detroit's Comerica Park (2000), San Diego's PETCO Park (2004), St. Louis' Busch Stadium (2006), the Mets' Citi Field (2009) and Minnesota's Target Field (2010). And several more that play mostly neutral or have shown fluctuations up and down, from year to year and, in part, depending on the home team's lineup construction: San Francisco's AT&T Park (2000), Houston's Minute Maid Park (2000), Milwaukee's Miller Park (2001), Pittsburgh's PNC Park (2001) and Washington's Nationals Park (2008).
4) There has been an increase in the late movement of pitches, primarily through the popularity of the cutter. While there's always a new pitch en vogue -- the splitter was abundant in the 1980s; the circle change in the '90s -- the cutter seems to have taken longer for hitters to catch up.
Speaking at a baseball roundtable earlier this spring, Rays third baseman Evan Longoria said, "Pitchers figure out which guys have a hard time hitting, and obviously the cutter right now is hard. It's not an easy pitch to hit." The Twins veteran DH Jim Thome added, "What I see is more late movement than there was in the early '90s to the mid-'90s."
5) There has been a bumper crop of talented young pitchers entering the majors. Teams are placing greater emphasis and attention to detail on the development of arms -- by any number of methods, from regimented pitch counts in the minors to shoulder and rotator-cuff strengthening exercises -- making pitching an increasingly youthful proposition, as more pitchers are harnessing their talent and reaching the majors better equipped to compete right away.
In the time span considered, from 1992 through 2011, there have been 667 qualifying pitchers who have posted an ERA+ of at least 115, and a decreasing number of them are 30 or older. (ERA+ adjusts ERA for ballpark and the league standard, with 100 as an average score.) From the first decade to the second, fewer pitchers age 30 or older met the chosen standard, while the overall number went up. From 1992 through 2001, 42.1 percent of 309 seasons with an ERA+ of at least 115 were by pitchers of age 30 or older; from 2002 through 2011, that share fell to 30.2 percent of 358 such seasons.
6)In 2001 MLB issued a directive to standardize the strike zone. That directive restored the zone to its official rule book definition, with more high and inside strike calls, while tightening up the extra inches that pitchers received off the outside corner. While it's difficult to quantify the exact impact that this change had, there is at least a correlation, if not a causation, to baseball's downward slope of run production from 2001 onward.
Similarly there has been a new effort to enforce the calling of the league-mandated strike zone. As of 2009, all 30 ballparks were outfitted with the league's Zone Evaluation system, a computerized way of monitoring which pitches an umpire calls balls and strikes that serves as a reminder to the men in blue what pitches the league thinks should be strikes. Each umpire, of course, still brings personal interpretation to the calling of balls and strikes, but even a little more uniformity to the process undoubtedly gives pitchers confidence to attack the zone in the same way each outing, rather than adapting (quite as much) to each umpire.
There's still plenty of time in the 2011 season for hitters to reassert themselves, but for now baseball remains a pitcher's game.


