Project Defense: Breaking down No. 2 Syracuse's zone efficiency
My hope with this charting project was to generate some fresh talking points about the 2-3 by quantifying each defender's individual impact. The sample was every possession of 15 games -- Syracuse's Big East schedule and its four biggest nonleague contests, against Virginia Tech, Stanford, Florida and N.C. State. The data reveals that:
• Sophomore 7-footer Fab Melo is simultaneously the Orange's most obvious defensive force (by blocking shots) and its secret weapon (by taking charges and creating turnovers).
• The centers in the 2-3 (Melo in particular) "end" twice as many possessions as the guards and wings, and thus have outsized importance.
• The quality gap between sophomore sixth man Dion Waiters and the other front-line guards is immense.
• The best defensive lineup features Waiters and Brandon Triche up top, and Kris Joseph, Melo and James Southerland across the back line.
After explaining how the charting process works, I'll dive into the actual numbers.
This is a continuation of the defensive project David Hess and I started for Sports Illustrated's college basketball preview issue, in which we presented extensive, individual-player charting data on North Carolina, Ohio State, UConn, Florida State and Vanderbilt. Because the traditional box score is so inadequate at assessing what goes into a defensive "stop," measuring only rebounds, blocks and steals, we used the Defensive Score Sheet method proposed by statistician Dean Oliver in his seminal 2003 book Basketball on Paper to log 100 games featuring the aforementioned teams. By tracking each player's forced misses, forced turnovers, fouls that created free throws, and baskets yielded, we were able to add another dimension to the box score. This allowed us to assign personal defensive ratings (DRatings) and quantify such things as Aaron Craft's astronomical turnover-creation rate, Tyler Zeller's quiet value, Kemba Walker's underrated D and Bernard James' prowess as a basket protector.
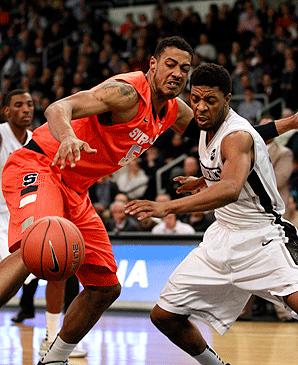
My in-season focus turned to No. 2-ranked Syracuse, which plays a zone that Boeheim says "is not really a zone -- it's a trapping, moving defense." Because there are rules to those movements, and players apply ball pressure rather than staying stationary, it was possible to chart the 2-3 on an individual level. It often required sharing blame or credit across multiple defenders on one play, and doing plenty of pausing and rewinding to see where rotations broke down. Many times, the player closest to the ball when it was scored wasn't the one at fault.
To give you a sense of what a one-game chart looks like, the Defensive Score Sheet from Syracuse's 95-70 win over St. John's on Saturday appears at the end of this paragraph. I went to Madison Square Garden to witness firsthand the return of Melo, the big Brazilian who anchors the Orange's zone and is third in the nation in block percentage (15.03). He missed the previous three games due to unspecified academic issues, and his effect on this contest was rather evident. He forced 10 missed shots and 1.5 turnovers, and his team-best Defensive Rating of 94.1 -- with a high engagement rate of 24.3 percent -- was well below Syracuse's game rating of 101.6:
[A brief explainer: A player's DRating is the answer to the question, "How many points would his team allow with him on the floor for 100 possessions?" The lower a player's DRating, the better he is as a defender. DRatings should be evaluated in relation to the team's overall rating for the game, which was 101.6.
A key to the chart headers, from left to right: DReb (defensive rebounds), FM (forced misses), FTO (forced turnovers), FFTA (missed free throws from fouls), DFGM (baskets allowed), DFTM (made free throws from fouls), Stops (possessions ended), ScPos (scoring possessions allowed), DPoss (total possessions engaged in), Stop% (percent of personal possessions ending in stops), %DPoss (percent of team possessions engaged in), DRating (personal defensive rating). The gray "Team" line is where unforced misses and turnovers, unblame-able transition/broken-play baskets and late-game intentional fouls are placed; their impact is spread across all players' DRatings.]
Melo had a fine afternoon against the Johnnies, but one game is hardly enough to make definitive conclusions about the value of a defender. Fifteen games, though, is a decent sample, and the chart below offers a comprehensive look at each Syracuse player's defensive DNA. It's separated into sections for each of the roles in the 2-3 -- top-line guards, back-line wings and back-line centers -- because responsibilities differ so much from position to position.
The DRatings (AdjDRating) have been adjusted for competition, which means that playing 20 stingy minutes against DePaul is not valued the same as playing 20 stingy minutes against Florida. DRatings should be evaluated on a scale in relation to the team's defensive efficiency during the 15-game sample (86.2), and differences of even 2-3 points between players should be regarded as very significant. Again, a player's DRating is the answer to the question, "How many points would an opponent score with this player on the floor for 100 possessions?"
[A key to the rest of the stats in the above chart: DPoss% (percentage of possessions directly engaged in), Stop% (percentage of possessions that end in stops), OppFG% (opponents' percentage on shots the player defends), OppTO% (percentage of possessions engaged in that end in turnovers), DFTA/DFGA (ratio of free-throw attempts created to field-goal attempts faced), DReb/40 (defensive rebounds per 40 minutes), FTO% (percentage of overall possessions played in which the player creates a turnover), AdjDRating (personal defensive rating, adjusted for competition).]
Melo does not have the Orange's lowest DRating (that belongs to Waiters), but it's clear that Melo has the biggest impact. His engagement rate, or DPoss%, of 26.1 is the highest on the team, and the fact that he's able to maintain a strong DRating (86.5) while impacting so many plays is impressive. Syracuse's entire 2-3 seems to take its cues from Melo. "The most important position in the zone is the center," assistant coach Mike Hopkins said. "Fab protects the paint ... he lets us be more aggressive on the perimeter, and he's the eyes for the whole defense, talking and directing everyone else."
The following graphic is a visualization of DPoss% across the 2-3 alignment -- basically, how often a possession is ended (in a good or bad way) by each of the various defenders. This should help you grasp the outsized importance of the middle men:
Not only is Melo more "engaged" than his backup at center, Baye Moussa Keita, Melo is a much stingier defender who creates more turnovers and fouls about half as frequently.
(If you're wondering why the sum of the percentages in the chart is closer to 75 than 100, it's because in any given game, a sizable chunk of possessions are logged as "team." Those are the unforced misses and turnovers, or the unblame-able transition/scramble baskets allowed, and the impact of those possessions is spread across everyone who was on the floor.)
Take a minute to review the second-to-last column in the team totals chart, which is FTO%, or turnovers forced per 100 possessions played. It's not a surprise that Waiters is the team leader, creating a turnover on 5.8 percent of his possessions played, and on an amazing 38.8 percent of the possessions in which he directly engages. Almost all of Waiters' turnovers are on steals, and kenpom.com ranks him third nationally in steal percentage on the season.
The unexpected figure in the FTO% column belongs to Melo, who appears nowhere in the national steal standings, but manages to create turnovers at almost the same rate Waiters does -- 5.6 percent of the time. The explanation? Melo is a charge-taking machine. Syracuse has a charges leaderboard up in its locker room at the Carrier Dome, and Melo leads the Orange with 17 charges taken. The next-closest player is C.J. Fair, with six. "I tell Fab all the time, a charge is really better than a blocked shot," Boeheim said. "We get the ball, they get a foul, and it keeps them from driving hard at the basket."
Combine Melo's charges with his occasional steals, the plays on which he steps up and forces a driver to lose the ball or pass it out of bounds, and his handful of smother-blocks (when he blocks a shot and corrals it in one motion) -- all of which he gets credit for in this charting system -- and you get the full picture of his turnover-creation. Hardly any of it appears in the box score, making him grossly underrated by traditional metrics. By looking at the official stat sheet from the Orange's 73-66 win over Marquette on Jan. 6, you'd have no idea that Melo took four charges in the first half alone, and accounted for more than a fourth of Syracuse's overall turnover production.
On centers: The defensive drop-off during Melo's absence, which included the Orange's lone loss, to Notre Dame, and wins over Cincinnati and West Virginia, was to be expected. While his primary backup at the center spot, sophomore Baye Moussa Keita, has a similar rate of success challenging shots (opponents shoot 30.4 percent against Keita and 29.1 percent against Melo), Keita takes fewer charges and fouls almost twice as often.
Keita creates a team-high 64.0 free throws per 100 field-goal attempts faced (DFTA/DFGA, in the chart) as opposed to 37.7 for Melo. When the Fighting Irish upset Syracuse on Jan. 21 in South Bend, Keita created eight free throws that resulted in six points. Freshman Rakeem Christmas, who has the team's worst DRating, became Keita's backup at the center spot during that stretch.
On back-line wings: Senior Kris Joseph, who's the team's leading scorer, doesn't get much praise for his D, but he has the second-best DRating on the team and the best of any of the wings. He doesn't engage in many possessions (with a DPoss% of 13.0), but he does a nice job of challenging shooters on the corners and wings, and has enough of a knack for deflecting passes that he has a FTO% of 3.8. Joseph's one flaw is that he's not a great rebounder from the wing, which leads to the Orange giving up plenty of offensive rebounds when Melo lunges out to challenge shots. (Sophomore James Southerland, on the other hand, is a solid rebounder from the wing, but he fouls so often that it hurts his defensive value.)
On front-line guards: As I wrote earlier, a difference of just a few points in DRating is significant, so the gap between Waiters (82.9) and fellow guards Brandon Triche (87.1) and Scoop Jardine (88.3) should be regarded as immense. Waiters creates turnovers at a much higher rate than the other guards do, and he has the size and range to recover and contest more shots on the perimeter. Boeheim said that he's instructed his guards to extend the zone and apply more pressure to shooters in the past two years, and Waiters and Triche do the best job of this.
Opponents shoot 33.0 percent on shots against Waiters, 45.2 against Triche and 60.0 against Jardine, whose percentage is so high because he gets blamed for plenty of threes but rarely forces many misses. His standard operating procedure is to merely walk toward a shooter and reach out for his waistband while he's in the air. This means Jardine never fouls -- his DFTA/DFGA of 10.2 is a team-low -- but it's not an exceptionally effective way of guarding quality gunners.
If freshman Michael Carter-Williams cuts down on his ill-advised fouling (he creates free throws at more than five times the rate Jardine does), he could be a formidable top-line defender. At 6-5 he's the best rebounder of any of the guards, and he creates the second-most turnovers per possession after Waiters. If no one leaves early for the NBA Draft, and Waiters, Carter-Williams and Melo play even more minutes together next season, they might even force more take-aways. But there's no sense in looking that far ahead, when this Syracuse team is already better at forcing turnovers than any other title contender.