%20%20--%3E%0A%3Csvg%20version%3D%221.1%22%20id%3D%22Layer_1%22%20xmlns%3D%22http%3A%2F%2Fwww.w3.org%2F2000%2Fsvg%22%20xmlns%3Axlink%3D%22http%3A%2F%2Fwww.w3.org%2F1999%2Fxlink%22%20x%3D%220px%22%20y%3D%220px%22%0A%09%20width%3D%2239px%22%20height%3D%2240px%22%20viewBox%3D%220%200%2039%2040%22%20enable-background%3D%22new%200%200%2039%2040%22%20xml%3Aspace%3D%22preserve%22%3E%0A%3Cpath%20fill%3D%22%23FFFFFF%22%20d%3D%22M38.5%2C7H28.2v26h10.3V7z%22%2F%3E%0A%3Cpath%20fill-rule%3D%22evenodd%22%20clip-rule%3D%22evenodd%22%20fill%3D%22%23FFFFFF%22%20d%3D%22M26.1%2C25.5c0%2C5.8-4.1%2C7.5-12.9%2C7.5C3.9%2C33%2C0%2C31.2%2C0%2C25.2v-1.1h11.6%0A%09v2.4c0%2C0.7%2C0.1%2C1.4%2C1.2%2C1.4c1%2C0%2C1.2-0.4%2C1.2-1.3v-0.9c0-1.6-0.9-1.6-3.5-2.2C2.2%2C21.7%2C0%2C19.7%2C0%2C15.3v-0.9C0%2C9.3%2C5.5%2C7%2C12.9%2C7%0A%09c10.2%2C0%2C12.8%2C2.6%2C12.8%2C7.4v1.8h-11v-2.9c0-0.6-0.4-1.1-1.2-1.1c-0.6%2C0-1.2%2C0.4-1.2%2C1.1v0.9c0%2C1.5%2C0.9%2C2%2C3.3%2C2.5%0A%09c8%2C1.6%2C10.5%2C3.3%2C10.5%2C7.5V25.5z%22%2F%3E%0A%3C%2Fsvg%3E%0A)
How an NHL team’s system affects a player’s performance

Sometimes hard numbers give the illusion of objectivity and permanence. For example, people see that a particular player has bad possession stats and conclude that he must be a bad player, or at least a bad possession player. Seems obvious, right?
The truth’s not so simple.
Now, before all you hockey traditionalists declare hockey analytics dead and start your victory dances, let me clarify. The reason it’s hard to measure how good a player really is isn’t that advanced stats are inaccurate (though they can be) or even that they’re misused or misinterpreted (though they often are). It isn’t even that advanced stats can’t tell us with reasonable accuracy what a player’s contribution to his team has been in the past.
The reason why assessing a player’s true ability is really tricky is because productivity doesn’t necessarily match ability. Productivity is often much more a result of his team systems than most people realize. In other words, the same player might do better or worse—sometimes much better or much worse—if he played in a different system. If the traditionalists out there are looking for a win, maybe this is the nebulous “chemistry” between a coach and his players that they always seem to be talking about.
Let’s look at a concrete example. The most widely accepted advanced stat is your run-of-the-mill Corsi (aka “shot attempt differential”). Even the relatively uninitiated can tell you that a Corsi For percentage (CF%) above 50% means that a team is attempting more shots than its opponents, which generally means that the team is carrying the play. At the team level, the CF% metric, while far from perfect, tends to be a pretty good starting point for assessing whether a team is playing well or not.
Assist by the Great One: How Wayne Gretzky redefined scoring in the NHL
At the player level, a refinement called CF% “RelTM” is often used. It measures a player’s Corsi not in absolute terms, but relative to his team’s average when he’s not on the ice. That allows us to control for a situation where a player’s CF% is inflated (or deflated) because he plays on a particularly good (or bad) team. For example, defenseman Drew Doughty has a CF% of 59.2, but because the Kings’ team CF% without him on the ice is 55.8, his CF% RelTM is only 3.4. [For reference, backliner Aaron Ekblad of the Panthers has the highest CF% RelTM in the league, at 13.3]. The idea is that the Kings’ Corsi is already 55.8 without Doughty, so Doughty shouldn’t get bonus “credit” for the contributions of of the players with whom he shares ice time. CF%RelTM uses the team average as the baseline and then measures whether the particular player adds or detracts from it.
As one might expect from the fact that Doughty and some of the other best players in the game aren’t at the top, the CF% RelTM stat isn’t considered the final word, but it nevertheless is generally accepted to be an important metric for measuring how good a player is.
Maybe it shouldn’t be.
Take James van Riemsdyk. In mid-January 2015, just after Randy Carlyle was fired as coach of the Maple Leafs, JVR ranked 391st out of 391 forwards in CF%. Under Carlyle’s system (which seemed intent on funneling all of the play toward the Leafs’ goal), van Riemsdyk’s numbers were almost impossibly bad. His Corsi For per 60 minutes (CF60) was 51.6 and his Corsi Against per 60 minutes (CA60) was 73.7, meaning that for every 60 minutes JVR was on the ice (five-on-five) the opposition attempted 22.1 more shots than the Leafs did. Van Riemsdyk’s CF% RelTM was –5.8, which is bad under any circumstance, but truly dismal considering the team to which he was “Rel” was the lowly Maple Leafs. “Ugly” doesn’t begin to describe these numbers.
One could be forgiven for thinking that JVR wasn’t much of a player.
Enter (with great fanfare) new Leafs coach Mike Babcock. Sure, he’s won two Olympic gold medals and a Stanley Cup, but is he really that good a coach, or was he just fortunate to be standing behind benches with Sidney Crosby, Jonathan Toews, Carey Price, Doughty, et al. during the Winter Games and Lidstrom, Datsyuk, Zetterberg, Rafalski, et al. in the NHL playoffs?
Don’t answer yet. First, take a look at what JVR has done while playing in coach Babcock’s system with its emphasis on possession, speed, pressure in the offensive zone and full-ice defense.
But before the big reveal, let’s add just a little more context. Last season van Riemsdyk’s right wing was all-star Phil Kessel; now it’s Leo Komarov, who you’ve probably never heard of if you don’t live in Toronto. And his centerman last season was supposed defensive stalwart Tyler Bozak, who’s been replaced by the enigmatic NazemKadri. Seems like a recipe for disaster, right?
Not so much.
This season JVR ranks ninth in the league in CF% RelTM, at +9.9.
<p> <p>CF% RelTM </p> <p>NHL Rank</p> </p> | <p>PLAYER</p> | <p>CF% RelTM</p> | <p>CF%</p> |
|---|---|---|---|
1 | Aaron Ekblad, Panthers | 13.3 | 55.9 |
2 | Mikko Koivu, Wild | 12.0 | 56.7 |
3 | Jason Zucker, Wild | 12.0 | 56.6 |
4 | Teemu Pulkkinen, Red Wings | 11.4 | 57.7 |
5 | Barret Jackman, Predators | 11.4 | 62.4 |
6 | Evander Kane, Sabres | 11.0 | 55.0 |
7 | Mathieu Perrault, Jets | 10.6 | 59.5 |
8 | Seth Jones, Predators | 10.5 | 61.2 |
9 | James van Riemsdyk, Maple Leafs | 9.9 | 56.0 |
10 | Brian Campbell, Panthers | 9.7 | 43.4 |
* stats courtesy of war-on-ice.com
As the graph below shows, van Riemsdyk has produced almost unheard of improvements in both offense and defense at the same time. The blue bars are JVR’s numbers this season under Babcock and the red bars are his numbers last season up to the point when Carlyle was fired (note that a higher number for CA60 is bad). His CF60 has jumped 12.2 points from 51.6 to 63.8, while at the same time his CA60 has plummeted from an astronomical 73.7 to a pretty darn respectable 50.1, a difference of 23.6 points!
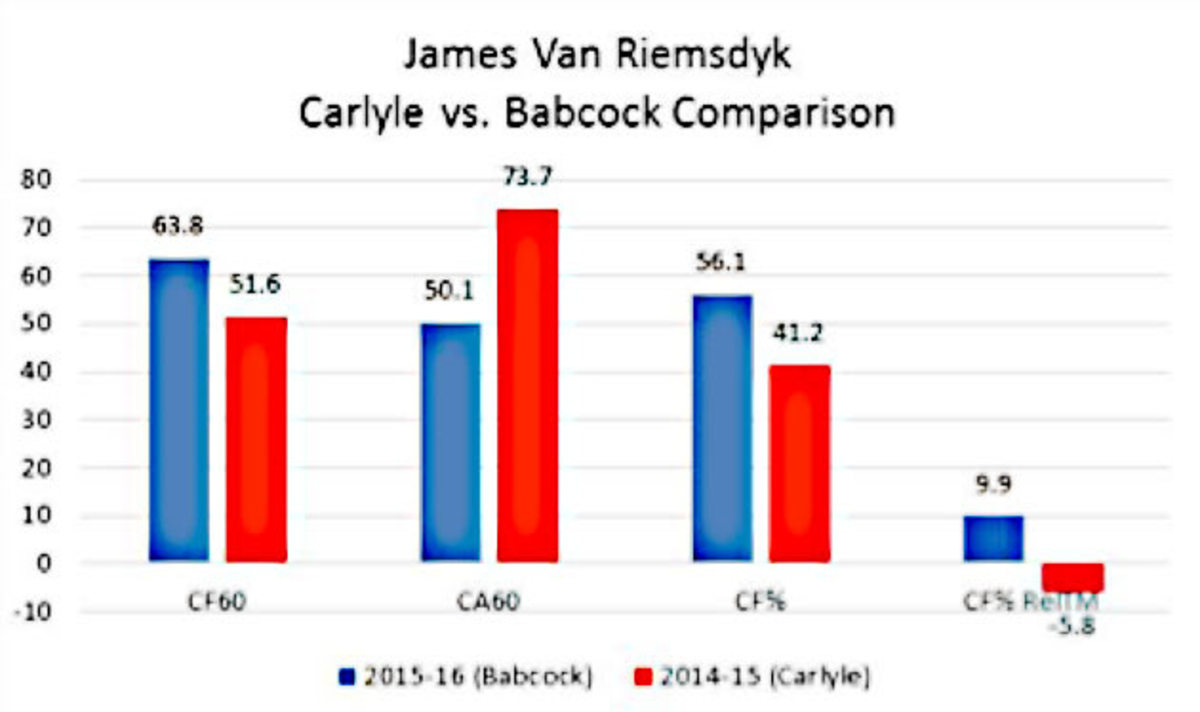
When JVR was on the ice last season the opposition attempted 22.1 more shots per 60 minutes than the Leafs. Now the Leafs are attempting 12.7 more than their opposition, for a difference of 33.8 shot attempts per 60.
With all due respect to linemates Kadri and Komarov, and to JVR himself, an improvement this dramatic has to be attributable primarily to the difference in the systems that van Riemsdyk has played in. Let us say that again: JVR’s massive improvements almost certainly have much more to do with system than with anything he has done to develop his game.
Pain Is Coming: Mike Babcock goes from killing floor to Maple Leafs
This has huge implications for how teams should be assessing players. Even if stats like CF% and CF% RelTM give some insight regarding a player’s current contribution to his team, they may not tell us as much as we think about what the player could contribute either under a different system on the same team or on other teams (with the associated trade implications). The same player may have dramatically different values depending on the way that he’s used. Think Bill Belichick and the NFL’s New England Patriots, who don’t have a single first-round draft pick in their starting offense, but who win year after year because of Belichick’s ability to identify players who fit his system and develop that system around their abilities.
Many analytics guys seem to believe that the numbers speak an inviolate, permanent truth about players’ abilities. But numbers measure past performance, and performance won’t measure a player’s true ability if the player isn’t being used optimally. A team that can identify players whose performances will increase when slotted into its system will be able to acquire undervalued assets. The Patriots have won four of the last 14 Super Bowls using this kind of approach. This will be the next wave of hockey analytics.
Perception, deception and Calgary’s defense
At the end of last season and the beginning of this one, commentators were proclaiming Calgary’s defensive unit to be one of the top, if not the very best, in the league.
Another swing and a miss for the cognoscenti.
So far in 2015-16, Calgary ranks dead last in goals against, averaging 3.58 per game, which is just under half-a-goal per game more than the next worst team (the Jets, at 3.16).
So how did Calgary's vaunted defense suddenly turn from gold into garbage?
The answer is: It didn’t. Believe it or not, if anything Calgary’s defense is better this season than last.
The disconnect isn’t with the Flames’ defense, it’s in everyone’s perception of it.
The assessment of Calgary’s defense last season clearly wasn’t attributable to the team’s goals-against numbers: Calgary was an unimpressive 16th. Rather, the justification that most commentators gave for their glowing assessment was that the Flames scored by far the most points by any group of defensemen in the league, with over 200.
What can the Penguins do to jumpstart their sputtering offense?
We’re going to propose what is apparently a radical suggestion: Because a defenseman’s primary responsibility is to keep the puck out of his own team’s net, the best way to assess a group of blueliners isn’t by relying on stats that reflect only offensive contributions.
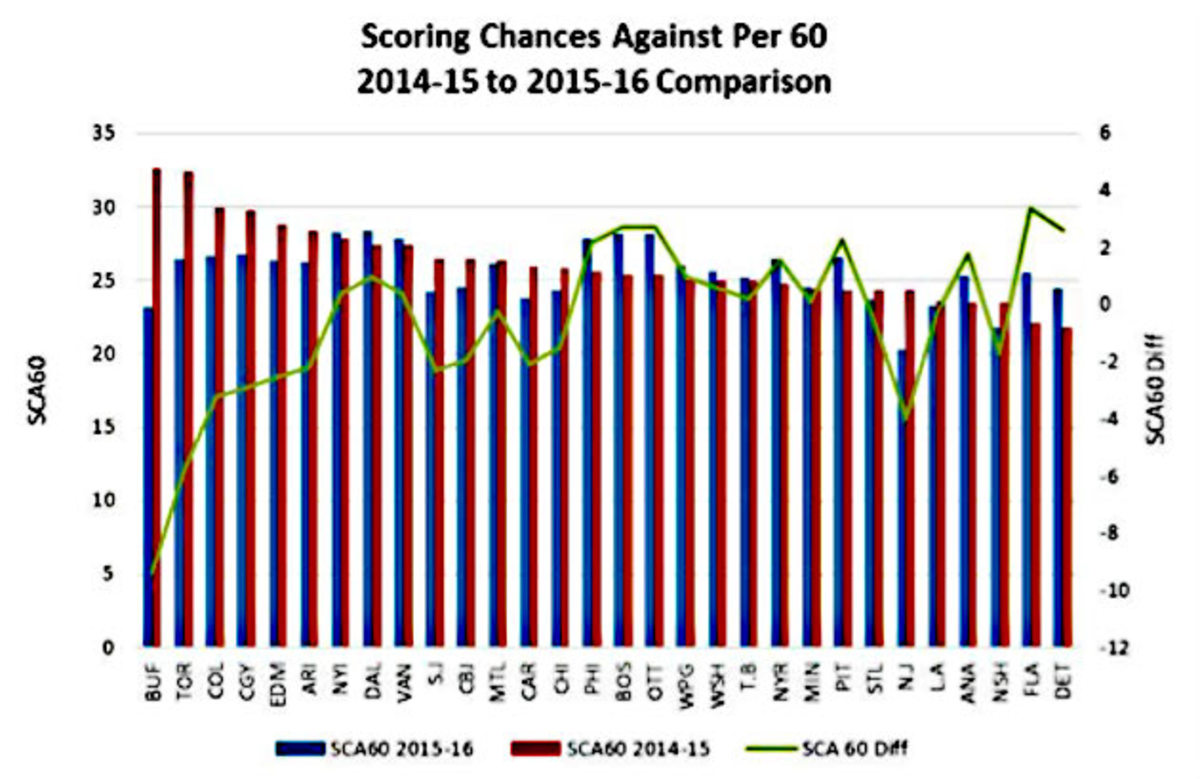
Instead, one metric that focuses on actual defensive play is "scoring chances against.” As the table and graph show, last season Calgary’s defense allowed the fourth most five-on-five scoring chances per 60 minutes (SCA60), at 29.7 (Detroit allowed the fewest, at 21.8.) There is virtually no possibility that a team allowing almost 30 scoring chances against per 60 is anywhere close to the top, or even the middle, of the league in defensive play.
This season, the Flames’ SCA60 has actually decreased by 2.9, which is a bigger improvement than all but four other teams. (If we haven’t praised Babcock enough, you’ll note that his Leafs’ SCA60 has improved by 5.9 while his former team, the Red Wings, has gotten worse by 2.6.) In other words, despite all the commentators’ recent bewilderment as they ponder what has happened to Calgary’s great back end, the Flames’ defense seems to have actually gotten noticeably better.
<p>Team</p> | <p>SCA60 2014-15</p> | <p>SCA60 2015-16</p> | <p>SCA60 Difference</p> |
|---|---|---|---|
BUFFALO | 32.6 | 23.2 | –9.4 |
TORONTO | 32.4 | 26.5 | –5.9 |
COLORADO | 29.9 | 26.7 | –3.2 |
CALGARY | 29.7 | 26.8 | –2.9 |
EDMONTON | 28.8 | 26.3 | –2.5 |
ARIZONA | 28.4 | 26.2 | –2.2 |
NY ISLANDERS | 27.8 | 28.2 | 0.4 |
DALLAS | 27.4 | 28.4 | 1 |
VANCOUVER | 27.4 | 27.8 | 0.4 |
SAN JOSE | 26.5 | 24.2 | –2.3 |
COLUMBUS | 26.4 | 24.5 | –1.9 |
MONTREAL | 26.3 | 26.1 | –0.2 |
CAROLINA | 25.9 | 23.8 | –2.1 |
CHICAGO | 25.8 | 24.3 | –1.5 |
PHILADELPHIA | 25.6 | 27.8 | 2.2 |
BOSTON | 25.4 | 28.1 | 2.7 |
OTTAWA | 25.4 | 28.1 | 2.7 |
WINNIPEG | 25 | 26 | 1 |
WASHINGTON | 25 | 25.6 | 0.6 |
TAMPA BAY | 25 | 25.2 | 0.2 |
NY RANGERS | 24.8 | 26.4 | 1.6 |
MINNESOTA | 24.4 | 24.5 | 0.1 |
PITTSBURGH | 24.3 | 26.6 | 2.3 |
ST. LOUIS | 24.3 | 23.7 | –0.6 |
NEW JERSEY | 24.3 | 20.3 | –4 |
LOS ANGELES | 23.6 | 23.3 | –0.3 |
ANAHEIM | 23.5 | 25.3 | 1.8 |
NASHVILLE | 23.5 | 21.8 | –1.7 |
FLORIDA | 22.1 | 25.5 | 3.4 |
DETROIT | 21.8 | 24.4 | 2.6 |
The difference isn’t in Calgary’s defensive play, it’s just in the results. Calgary’s goaltending this season has been weak (with a team five-on-five save percentage of 89.6% versus 92.2% last year), and the team hasn’t been able to pull out the repeated miraculous third-period comebacks it did in 2014-15, leaving last spring’s playoff darlings tied for last overall, with a record of 9-14-2 and a league-worst goal differential of –30.
In other words, as is very, very often the case, the team’s results last season tricked even the so-called experts into believing an illusion. Calgary’s defense was pretty much what we’re seeing this season. It’s just that most people didn’t really notice since they were distracted by the goalies’ superior play and the shiny offensive numbers that the defensemen were putting up.
The Department of Hockey Analytics employs advanced statistical methods and innovative approaches to better understand the game of hockey. Its three founders are Ian Cooper (@phil_doha), a lawyer, former player agent and Wharton Business School graduate; Dr. Phil Curry (@ian_doha), a professor of economics at the University of Waterloo; and IJay Palansky, a litigator at the law firm of Armstrong Teasdale, former high-stakes professional poker player, and Harvard Law School graduate. Visit us on line at www.depthockeyanalytics.com