Zimmermann leaps to top of wide-open NL Cy Young field
Though we'll never know for sure, the trade deadline may have altered the National League Cy Young race by sending Ryan Dempster, the major league ERA+ leader, and Zack Greinke to the other league. Dempster hadn't factored in my rankings due to his two disabled list stints, and Greinke had a 3.44 ERA for the Brewers, but it's not out of the question that either could have entered the race with a strong final two months.
With those two out of the picture and mid-season leaders R.A. Dickey and Matt Cain cooling off of late, the NL Cy Young race is lacking a truly dominant performance. Fortunately, the American League race more than makes up for it with a tightly bunched sextet of outstanding seasons, one of which I had to eliminate given that I only have five spots to work with here (sorry, David Price).
NOTE: All stats are through Wednesday, August 1. League leaders are in bold, major league leaders in bold italics. The number in parentheses after each player's name reflects his rank on the previous list.
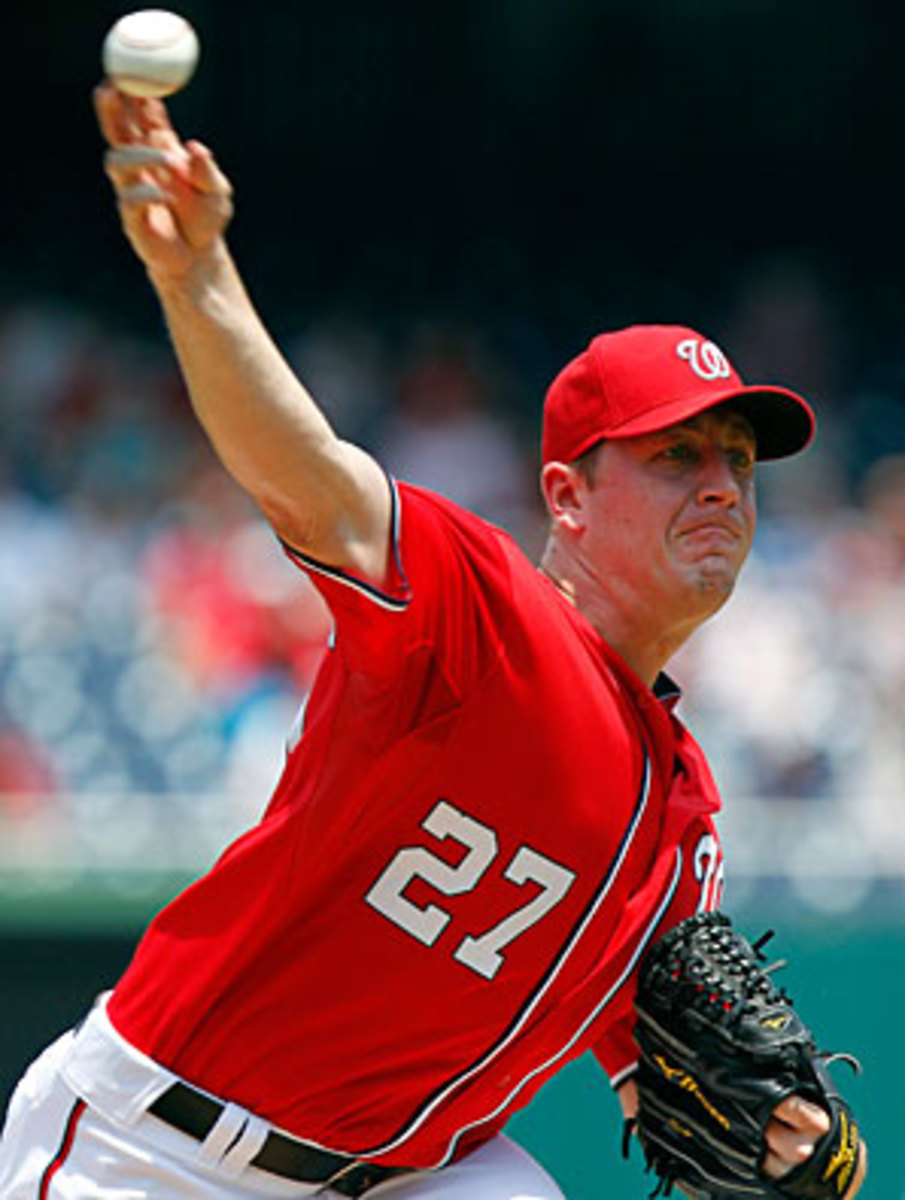
1. Jordan Zimmermann, RHP, Nationals (N/A)
Season Stats: 8-6, 2.28 ERA, 1.07 WHIP, 6.4 K/9, 4.00 K/BB, 6.4 IP/GS, 175 ERA+
Last Four Starts: 3-0, 0.75 ERA, 0.79 WHIP, 8.3 K/9, 11.00 K/BB, 6.0 IP/GS
While teammates like Stephen Strasburg and Gio Gonzalez have been regular in this space, Zimmermann has been lurking just outside my top five for most of the season. He leaps to the top of the class this week on the strength of a red-hot run in which he hasn't allowed more than one earned run in any of his last seven starts and has allowed just five runs total over that span to go 5-0 with a 1.02 ERA since the end of June. Zimmermann has completed at least six innings in every one of his starts this season, leads the major leagues with 19 quality starts (in 21 turns), and both of his non-quality starts saw him allow just four runs in six innings.
On only one other occasion did he allow as many as four runs in a game, and in that game one run was unearned. All three of those four-run starts came in May, and he has allowed as many as three runs just twice in his 11 starts since the calendar flipped to June (5-1, 1.80 ERA).
Impressive as all of that is, Zimmermann also hasn't pitched more than seven innings in any of his starts this season as the Nationals are still being careful with his arm. Zimmermann is 26, three years removed from Tommy John surgery, and his 161 1/3 innings last year were a career high. With Stephen Strasburg still scheduled to be shut down once he reaches his innings limit this year, the Nationals need to keep Zimmermann available through the playoffs without putting him at risk.
As a result, he has reached 100 pitches just seven times in 21 starts, has come out before 100 pitches in each of his last seven starts and has come out before reaching 90 pitches six times this year, including in two of his last four turns. That's partially a testament to Zimmermann's efficiency; he has walked just 1.6 men per nine innings this year, but despite all that coddling, he has experienced some shoulder inflammation recently and is getting an extra day of rest this week as a result.
2. Johnny Cueto, RHP, Reds (2)
Season Stats: 13-5, 2.39 ERA, 1.21 WHIP, 6.8 K/9, 3.12 K/BB, 6.6 IP/GS, 2 CG, 175 ERA+
Last Four Starts: 4-0, 2.55 ERA, 1.54 WHIP, 7.3 K/9, 2.22 K/BB, 6.2 IP/GS
In two starts against the Rockies this season, including one on July 28, Cueto has allowed 10 runs (nine earned) in 10 2/3 innings. In 19 starts against the rest of the major leagues (not inlcuding his Thursday afternoon start against the Padres in Cincinnati), he has only once allowed more than three runs in a start and posted an aggregate ERA of 1.96. Fortunately for him, the Reds don't play Colorado again for the rest of the year.
3. Ryan Vogelsong, RHP, Giants (5)
Season Stats: 8-5, 2.22 ERA, 1.13 WHIP, 6.6 K/9, 2.21 K/BB, 6.8 IP/GS, 158 ERA+
Last Four Starts: 1-2, 2.08 ERA, 1.19 WHIP, 8.0 K/9, 2.56 K/BB, 6.5 IP/GS
Vogelsong actually trumps Zimmermann as the most consistent starter in the major leagues this year. He has one fewer quality start than Zimmermann (18 to 19), but due to a season-opening injury, has made two fewer starts on the season and thus leads the majors in quality start percentage (95 percent). The exception came back on April 26 and saw him allow just four runs in six innings. Since then he has turned in 16 straight quality starts, going seven innings in 13 of them, and allowing as many as three runs in just three of them for a 1.88 ERA over that stretch. However, he has not completed eight innings in a single start this season and, unlike Zimmermann, that can't be blamed on coddling from management.
R.A. Dickey, RHP, Mets (1)
Season Stats:14-2, 2.83 ERA, 1.03 WHIP, 9.0 K/9, 4.45 K/BB, 6.9 IP/GS, 3 CG, 2 SHO, 134 ERA+
Last Four Starts*: 2-1, 4.78 ERA, 1.48 WHIP, 8.2 K/9, 3.43 K/BB, 6.3 IP/GS
Since his back-to-back one-hitters in mid-June, Dickey has posted a 4.56 ERA in seven starts and one relief appearance (*that relief appearance is included in his Last Four Starts line above). Just two of those seven starts have been quality. That seems like an overcorrection. In his first two seasons with the Mets, Dickey posted a 3.08 ERA, so it seems as likely that he'll rebound from this rough stretch as it was that he'd cool off from his historic hot streak in June. In the meantime, it's that incredible run of six mid-season starts that is keeping him on this list.
Matt Cain, RHP, Giants (3)
Season Stats: 10-4, 2.82 ERA, 1.00 WHIP, 8.3 K/9, 4.50 K/BB, 7.0 IP/GS, 2 SHO, 125 ERA+-
Last Four Starts: 1-1, 3.76 ERA, 1.22 WHIP, 5.8 K/9, 2.83 K/BB, 6.6 IP/GS
Cain has posted a 4.01 ERA in eight starts since his perfect game, and only half of those outings have been quality. One reason for the change has been the longball. Despite being an extreme fly ball pitcher, in his first 13 starts this season (in which he went 8-2 with a 2.18 ERA), Cain allowed just seven home runs at a rate of 0.66 per nine innings. Since then, he has allowed nine more taters in eight turns at a rate of 1.57 per nine innings. In those last eight outings, Cain has also experienced a small correction in his luck on balls in play and seen his walk and strikeout rates return to something closer to his career averages.
So much for this being a breakout year for Cain. Outside of his strikeout-to-walk ratio, his overall numbers are starting to look a lot like they have over the last couple of years. That's not a bad thing, but it's not a Cy Young thing, either.
Off the list: James McDonald (4)
1. Justin Verlander, RHP, Tigers (1)
Season Stats: 11-7, 2.63 ERA, 0.97 WHIP, 8.5 K/9, 3.80 K/BB, 7.3 IP/GS, 6 CG, 1 SHO, 159 ERA+
Last Four Starts: 2-2, 2.89 ERA, 1.11 WHIP, 7.7 K/9, 2.40 K/BB, 7.0 IP/GS, 1 CG*
Those who don't look past triple crown stats will shocked that I don't have AL wins and ERA leader Jered Weaver first on this list. Of course, wins are a team-bases statistic, heavily dependent on run and bullpen support, something even the typically traditionalist awards voters have come to recognize in recent years. Verlander has received just 3.6 runs per 27 outs of support from the Tigers lineup, thrice failing to pick up a win in a game in which he threw eight innings and allowed two or fewer runs, enough to make up the difference between his win total and that of Weaver, who in stark contrast to last year, has received 6.8 runs of support per 27 outs.
As for ERA, if you adjust it for the player's ballparks and present it as a percentage of the league average, you get their ERA+, a Baseball-Reference stat that I've added to the Season Stats lines this week. Looking at ERA+, Verlander has been 96 percent as effective as Weaver in 32 percent more innings. Throw in Verlander's nearly identical WHIP and superior strike zone peripherals and he's the clear choice for me, though this is shaping up to be a very compelling race.
*Verlander's last complete game lasted just five innings in a rain-shortened loss to the Red Sox. He threw 107 pitches in those five innings and, by game score, it was actually his third-worst start of the year.
2. Chris Sale, LHP, White Sox (2)
Season Stats: 12-3, 2.61 ERA, 1.02 WHIP, 8.3 K/9, 3.68 K/BB, 6.8 IP/GS, 1 CG, 165 ERA+
Last Three Starts: 2-1, 4.64 ERA, 1.36 WHIP, 6.8 K/9, 2.67 K/BB, 7.1 IP/GS
By the time Sale makes his next start, scheduled for Tuesday, he will have had three stretches of 10 days this season during which he didn't make a start. The first came in early May, when the White Sox briefly moved him into the bullpen due to concerns over some elbow pain he was experiencing. The second was around the All-Star break, when the Sox gave him a full 11 days of rest (the reason only his last three starts are tallied above). The third is right now as the team is giving him 10 days of rest between starts due to what they're describing as a dead-arm period.
Despite all those gaps, he has thrown two more innings than Weaver, who missed more than three weeks due to a back injury, and after adjusting for his launching pad of a home ballpark with ERA+, Sale has been every bit as effective as Weaver in those innings with, like Verlander, superior strike zone peripherals.
Second place on this list is a virtual coin-flip between Sale and Weaver at this point. If you throw out wins and losses, as I do, and consider that their adjusted ERAs are effectively identical (Weaver has a tiny right-of-the-decimal advantage, which is why he leads the league in ERA+ and Sale doesn't), the difference between the two comes down to Weaver's superior WHIP against Sale's superior strike zone peripherals. With the former being more defense-dependent, I'm going with Sale for the second spot.
Incidentally, Sale, the 13th overall pick in the 2010 draft, has now thrown 218 1/3 major league innings, roughly a full-season's worth, and has these career numbers: 16-6, 225 K, 2.60 ERA, 1.06 WHIP, 9.3 K/9, 3.31 K/BB. Yes, 95 1/3 of those innings came in relief, but that's still impressive.
3. Jered Weaver, RHP, Angels (3)
Season Stats:14-1, 2.29 ERA, 0.95 WHIP, 6.8 K/9, 3.41 K/BB, 6.4 IP/GS, 2 CG, 1 SHO, 165 ERA+
Last Four Starts: 4-0, 3.55 ERA, 1.14 WHIP, 6.8 K/9, 3.80 K/BB, 6.3 IP/GS
Here, finally, is Weaver and all of his bold-text stats. His late-May back injury is the primary reason he's "way" down here in third place (I use those sarcastic quotes because this race is so close). However, his dwindling strikeout rate (down from 9.3 in 2010, a roughly career-average 7.6 last year, and just 5.9 since his return from the disabled list) is both underwhelming and, in the bigger picture, something of a red flag. The other alarming thing about Weaver's season is his home/road split. Check this out:
Home: 9 GS, 8-0, 0.92 ERA, 0.65 WHIP, 7.7 K/9, 6.25 K/BB, 0.5 HR/9, 7.3 IP/GS*
Road: 10 GS, 6-1, 3.55 ERA, 1.23 WHIP, 6.0 K/9, 2.21 K/BB, 1.0 HR/9, 6.3 IP/GS
*Weaver hurt his back before recording an out in a home start against the Yankees on May 28. I've left that start out of the denominator in his IP/GS figure here.
On the road this season, Weaver hasn't been much better than league average. At home, he has been nearly unhittable. The only home start in which he didn't pick up a win was his injury-shortened start mentioned above, and one of the other eight was an actual no-hitter.
Weaver is no stranger to extreme home/road splits. Over the course of his career, his ERA at Angel Stadium has been 1.34 runs lower than his road mark, which was one reason that his decision to sign an extension with the Angels last year made so much sense. However that gap has nearly doubled this year, and while his opponent's batting average on balls in play on the road is close to his career mark (.277 this year to .279 career), his home BABIP is an absurdly low .178 (compared to .268 career).
4. Jake Peavy, RHP, White Sox (4)
Season Stats: 9-7, 3.04 ERA, 1.05 WHIP, 8.1 K/9, 4.32 K/BB, 7.0 IP/GS, 4 CG, 1 SHO, 142 ERA+
Last Four Starts: 2-2, 3.86 ERA, 1.29 WHIP, 8.4 K/9, 5.20 K/BB, 7.0 IP/GS
Peavy never really went away, but he has to be a candidate for the comeback player of the year award in the American League. Now 31, Peavy hasn't had a fully healthy season since he won the National League Cy Young in 2007 at the age of 26. In 2008, swelling in his elbow cost him a month. In 2009, he tore a muscle in his ankle and missed three months, a period during which the Padres traded him to Chicago. In 2010, he suffered a catastrophic, season-ending injury in early July when his latissimus dorsi actually detached from his pitching shoulder. He didn't return until May of the next year, then missed 16 days in June with a groin strain.
This year, however, Peavy has not only been healthy, but has ranked among the league leaders in innings pitched. He has already made more starts and thrown more innings than in any season since 2008, and he is on pace to reach 30 starts and 200 frames for the first time since '07 and to throw a career-high 231 innings. That alone is remarkable given his injury woes, particularly that lat injury, but that he has also largely rediscovered his effectiveness is especially impressive. Peavy isn't striking out more than a man per inning the way he was during his Padres peak, but he has reduced his walks to, thus far, equal his career-best strikeout-to-walk ratio, and that 142 ERA+ would stand as the second-best mark of his career, behind only his 158 mark from his Cy Young season.
5. Felix Hernandez, RHP, Mariners (N/A)
Season Stats: 9-5, 2.79 ERA, 1.15 WHIP, 8.9 K/9, 3.73 K/BB, 7.0 IP/GS, 2 SHO, 135 ERA+
Last Four Starts: 3-0, 1.44 ERA, 0.83 WHIP, 7.2 K/9, 4.17 K/BB, 7.8 IP/GS, 1 SHO
Hernandez had an ugly stretch of six starts from May into June in which he went 1-4 with a 6.37 ERA with just one quality start. That left him with a 4-5 record and a 3.70 ERA on the season in mid June. Prior to that he was 3-1 with a 1.89 ERA in seven starts, and since then, he has gone 5-0 with a 1.60 ERA in nine starts, two of them shutouts, and three of them (including both shutouts) seeing him strikeout 10 or more men against one or no walks. Hernandez allowed seven home runs over that lousy six-start stretch at a rate of 1.8 per nine innings. In his other 16 starts this season he has allowed just three home runs.
Hernandez skipped a start at the tail end of his rough stretch due to some back pain, but that seemed to be an isolated injury, not something related to his struggles. He was clearly off his game during that stretch, but he was also monstrously unlucky, with his opponents hitting .415 on balls in play. Since then, his BABIP has been a more conventional .287, which means the dominant King Felix is the real one, but you already knew that.
Off the list: C.J. Wilson (5)


