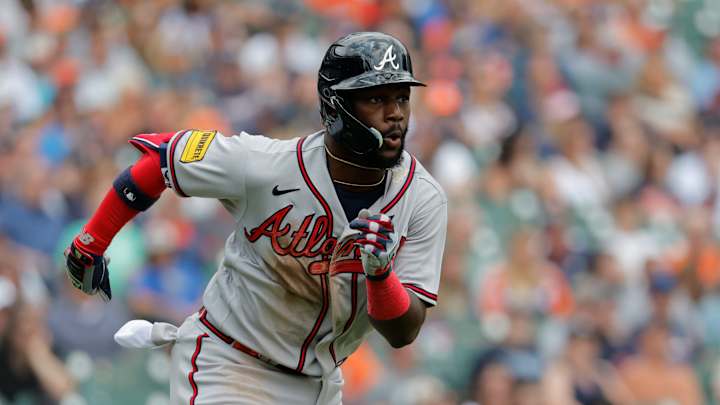
The Atlanta Braves have one of the deepest lineups in modern baseball history

I'm a fan of MLB.com's Mike Petriello.
Longtime baseball writer with experience at ESPN and Fangraphs, amongst others outlets, he always has really interesting insights into the game of baseball and is worth a follow on...I think it's called "X" now?
He wrote something new about the Atlanta Braves and how their offense is not just good (which we knew), but historically good.
No matter which conventional statistic - home runs, 1st inning runs - or newer statistic - OPS, hard-hit rate, exit velocity and barrel rates - Atlanta grades out as one of the best offenses in baseball.
So Mike took it a different direction in a recent article.
Atlanta has the deepest lineup in baseball history, according to Mike.
But what does that mean, exactly?
Mike points out that the #9 spot in the order, predominately filled by Michael Harris II, has an OPS of .812, which is better than twenty of baseball's twenty-nine leadoff hitters. In his own words: "The Braves are getting more production out of No. 9 than two-thirds of baseball are out of No. 1, and now you see what’s going on here."
But that doesn't cover the historic aspect...yet.
So here's what he did next: Looked at the number of at-bats in the season that went to hitters that were below average.
Mike chose to use Weighted Runs Created Plus, or wRC+, which is a stat from Fangraphs that sets league average production at 100 based on ballpark, offensive environment, etc.
And if the mathematically most average to exist right now were a 100 wRC+, Mike set the parameters to look to see how many at-bats in the Braves season went to hitters with a mark below 95.
(He chose 95 because that's where Eddie Rosario currently is, and a platoon outfielder batting 7th and on-track for 20 HRs is typically not a position you're desperately trying to improve upon).
The results are WILD. Going back to 1920, the Braves have the 2nd lowest percentage of their plate appearances going to players with a wRC+ below 95 at 8%, behind only the 1984 Detroit Tigers (5%).
| Percentage | Team | Final Record | Season Result |
|---|---|---|---|
5% | 1984 Detroit Tigers | 104-58 | won World Series |
8% | 2023 Atlanta Braves | ?? | ?? |
10% | 2003 Boston Red Sox | 95-67 | Lost ALCS |
10% | 1937 Chicago Cubs | 93-61 | 2nd place in NL* |
10% | 1985 Baltimore Orioles | 83-78 | 4th place in AL East |
Diving into the numbers myself, most these at-bats are some combination of Sam Hilliard (93 wRC+), Kevin Pillar (83 wRC+, although he did come up with a clutch hit last night for Atlanta) and Vaughn Grissom (70 wRC+) working in platoon or backup roles due to injury.
But wait, there's more!
Looking at slugging above league average, again normalized to 100, the Braves are at at 120, or 20% better than the rest of the league.
That mark would be best in MLB history, outranking the legendary 1927 Yankees (119) and the 1977 Red Sox (115).
Atlanta's bottom third of the lineup has the best collective slugging percentage (.450) in baseball of any lower third.
The middle third has the best collective slugging percentage (.510), as well.
The top third is 2nd, at .529, behind just the Los Angeles Dodgers.
Atlanta's got the weapons to get it done at the plate. If the pitching's there, too? Look out.
Check out Braves Today on Socials!
Follow Braves Today on Twitter!
Like Braves Today on Facebook!
Check out the homepage for more Atlanta Braves News!
Subscribe to Braves Today on YouTube!
Get Exclusive Braves Merchandise from FOCO

Managing Editor for Braves Today and the 2023 IBWAA Prospects/Minors Writer of the Year. You can reach him at contact@bravestoday.com
Follow @crosbybaseball