There Is No Statistical Comparison for the Brilliance of Jacob deGrom
Welcome to The Opener, where every weekday morning you’ll get a fresh, topical column to start your day from one of SI.com’s MLB writers.
In 2012, Cornell University mathematician Steven Strogatz wrote an essay for The New York Times titled “Visualizing Vastness,” about the difficulty of grasping large numbers:
“Admit it. You have no real feeling for the size of the solar system. That’s O.K. Nobody else does, either. Even knowing the numbers doesn’t help much. If I tell you the Earth is about 8,000 miles in diameter and 93,000,000 miles from the sun, does that give you any sense of the distances involved? No, because the numbers are too big.”
There are pathways to better understanding—context, visualizations, analogies—but there is no way to really know, to feel, what those numbers mean. They’re simply too far out of the realm of anything we should reasonably expect to encounter in the regular course of an earthly life. So: If I tell you that Jacob deGrom has a 0.51 WHIP and a 0.50 ERA, does that give you any sense of the performances involved? No, the numbers are too extreme.

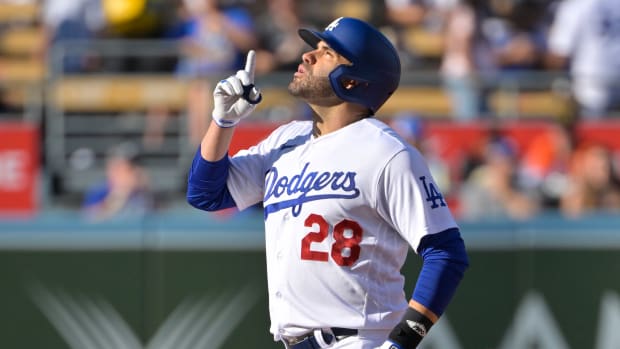
Brad Penner/USA TODAY Sports
On Monday, deGrom made his 12th start of the season, which looked more or less like every previous one, which is to say, dazzlingly, mind-bendingly good. It was yet another scoreless afternoon for him. He touched 100 mph five times in a perfect first inning—two swinging strikeouts and a flyout—and the rest of the game followed suit. deGrom has now pitched 30 consecutive innings without allowing a run. He leads starting pitchers in almost every relevant statistical category: ERA, ERA+, WHIP, opposing batting average, even the average number of pitches per inning. (No one is more efficient: 13.3 pitches thrown per frame.) He is the only starter whose ratio of strikeouts to walks is in double digits. His numbers are cartoonish, with structures that are vaguely recognizable as those of baseball statistics, but with the proportions all out of whack, figures that might be aesthetically pleasing but must be, must be, physically impossible.
Which points at the core question here: How do we think about the recent work of Jacob deGrom?
It is not so difficult to think about the work of most ballplayers. The how or why can be scrutinized or analyzed or debated, of course, but the what is typically straightforward enough. There is a collective understanding of the framework here: A .250 batting average, or 25 home runs, or a 2.50 ERA, these numbers likely each have a specific meaning to you. Hear them, and you might think of a player, or at least of a type of player. But “0.50 ERA”? Hear that, and laugh. It’s ridiculous! You should laugh. Sure, on a technical level, you know what it means. But how could you ever hope to understand it? No one has done this before. Earth is 93,000,000 miles from the sun, and Jacob deGrom’s ERA in late June is 0.50: These are facts, we know them to be true, yet there is a very real difficulty in how to conceptualize them.
So perhaps you want to turn to history for help. After all, where individual statistics cannot provide understanding, there’s often some context to be found in the record books: With thousands of players and millions of innings after almost a century and a half of organized baseball, it’s rare for there to be something that has never, ever been done before. But as Sarah Langs of MLB.com pointed out on Twitter on Monday … this falls into that category. deGrom’s 0.50 ERA is the lowest by any pitcher in his first 12 starts of the season since earned runs began being tracked in 1913. His 0.51 WHIP is the lowest by any pitcher over a 12-start span since 1901. He is the first pitcher with this many strikeouts and this few hits in 12 games. And on and on and on. But the most dramatic number of them all might be ERA+, putting him on a theoretically level playing field, adjusted for scoring environment and opponents, made for comparisons just like this. Think of the best pitching seasons of all time: 2000 Pedro Martínez (291 ERA+), or 1994 Greg Maddux (271), or 1968 Bob Gibson (258) or 1913 Walter Johnson (259). And then think of the fact that 2021 deGrom’s ERA+ is 777. His year is not just better than all of the storied ones listed above. It’s better several times over. The gap between 2021 deGrom and 2000 Pedro Martínez is bigger (far bigger!) than the gap between 2000 Pedro Martínez and a league-average pitcher. How are you supposed to conceptualize a pitcher like that?
Maybe you don’t. Maybe you do not bother trying to frame his performance with the statistics, or with the history, or even with any description of the motion of his slider or the velocity of his fastball. Maybe you think of only how his performance feels—so precious as to be a little fragile, each pitch carrying its own prayer for health, and yet so dominant that you have to imagine it could last forever. Which, of course, does not make any sense. (Any pitcher, no matter how historically good, is liable to have at least one bad start.) But “sense” is not the point here. For these numbers are not meant for humans to make sense of—they’re meant for us to marvel at.
More MLB Coverage:
• Odd-Year Magic? Why the Giants Are for Real
• MLB Power Rankings: Rays, White Sox Fall as New No. 1 Emerges
• Tragedy and Hope: An MLB Prospect, an MLB Scout and a Pop Fly
• 'A Game of Speech'—But Also, for Baseball Interpreters, so Much More