Survival Bracket returns to predict the national champion, Final Four and potential upsets

The model gives Rick Pitino's Louisville Cardinals an excellent chance at reaching a third straight Final Four. (Joe Murphy/Getty Images)

This is Year Three of the Survival Bracket, an experiment that forecasts the NCAA tournament using survival analysis. It's a statistical method, borrowed from clinical drug trials, that assesses teams based on their risk of failure, or how likely they are to fall out of the bracket at each of its six stages. The model's strength should be in the later rounds, and the 2012 Survival Bracket did quite well, nailing seven Elite Eight teams, three Final Four teams and the correct champ, while the 2013 bracket struggled, hitting on just one Final Four team (eventual champ Louisville) and taking Florida over the Cardinals in what it considered a coin-flip title game.
Survival analysis treats the NCAA tournament as a unique setting rather than just a series of matchups that might have occurred in the regular season. The model uses three control variables to build an initial 1-68 ranking of teams: kenpom.com's adjusted offensive and defensive efficiencies and the site's strength-of-schedule ratings. For example, here are kenpom.com's top 11 teams, along with their efficiency-based SOS:
The survival model then makes adjustments based on data that John found to correlate with NCAA tournament success, based on analysis of tourney results from 2004-13. The four significant factors are:
1. Consistency: how little a team's efficiency margin varies from game-to-game.
2. Experience, and especially tourney experience: a team's returning minutes percentage multiplied by the number of NCAA tournament games in which it appeared last season.
3. Out-Degree Network Centrality: The model builds an amazing matrix of where all 68 tourney teams' schedules intersected. The number of games played against NCAA tournament teams (network centrality) and the number of games won against NCAA tournament teams (the out degree, or arrows running away from a network node) were significant. Different values were assigned to home, road and neutral wins within the network. Basically, it's better to be a hub than a distant satellite:
4. The negative interaction of the Experience and Out-Degree Centrality variables. They're multiplied together to account for declining returns, so the model doesn't overestimate a deeply experienced team that played a schedule loaded with NCAA tournament members.
A Cox Proportional Hazards regression [PDF link] was applied to this data in order to re-rank teams 1-68, based on their relative risk of failure. We then used these rankings to fill out the 2014 Survival Bracket, which forecasts the same title game as last year's model did: Florida over Louisville. Can the Gators come through this time?
• The model adores Florida, the No. 1 seed in the South, for multiple reasons: It's one of just four teams that ranks in the top 20 in both adjusted offensive (17th) and defensive (5th) efficiency. Louisville and Arizona rank higher than the Gators in overall efficiency on kenpom.com, but the Gators played a tougher schedule than Louisville, are more consistent than Arizona and have more returning tournament experience than both of those teams.
• Had the selection committee done a better job of balancing the bracket, Wichita State would likely have been in our Final Four. The 34-0 Shockers ranked fourth in the survival model due to their combination of efficiency, experience and consistency. In fact, they were the most consistent No. 1 seed in our entire study sample from 2004-2014, based on standard deviations from average efficiency margin during the regular season. Here are the top 10 most consistent No. 1 seeds ...
… and the least consistent Nos. 1:
Inconsistent teams can win titles if they turn it on at the right time -- 2007 Florida did it! -- but the track record of the "consistent" top 10 is far more impressive.
• The model is also good at identifying boom-or-bust teams that have high levels of variance in their predicted tourney outcomes. While our bracket generally shies away from picking high-variance teams to go on deep tourney runs due to the risk, if one of them plays at the top end of its spectrum, it could outperform its seed.
Why is this worth mentioning? Because the highest-variance team on the top four lines of last year's bracket was none other than Michigan. The fourth-seeded Wolverines played at their high end and made it all the way to the national title game.
This year's highly seeded, highest-variance teams are Creighton (No. 3 in the West) and Michigan (No. 2 in the Midwest). Jump-shooting streaks could propel them into the Final Four ... or send them packing on the opening weekend. The next tier of high-variance teams is Villanova (No. 2 in the East), Virginia (No. 1 in the East) and Kansas (No. 2 in the South).
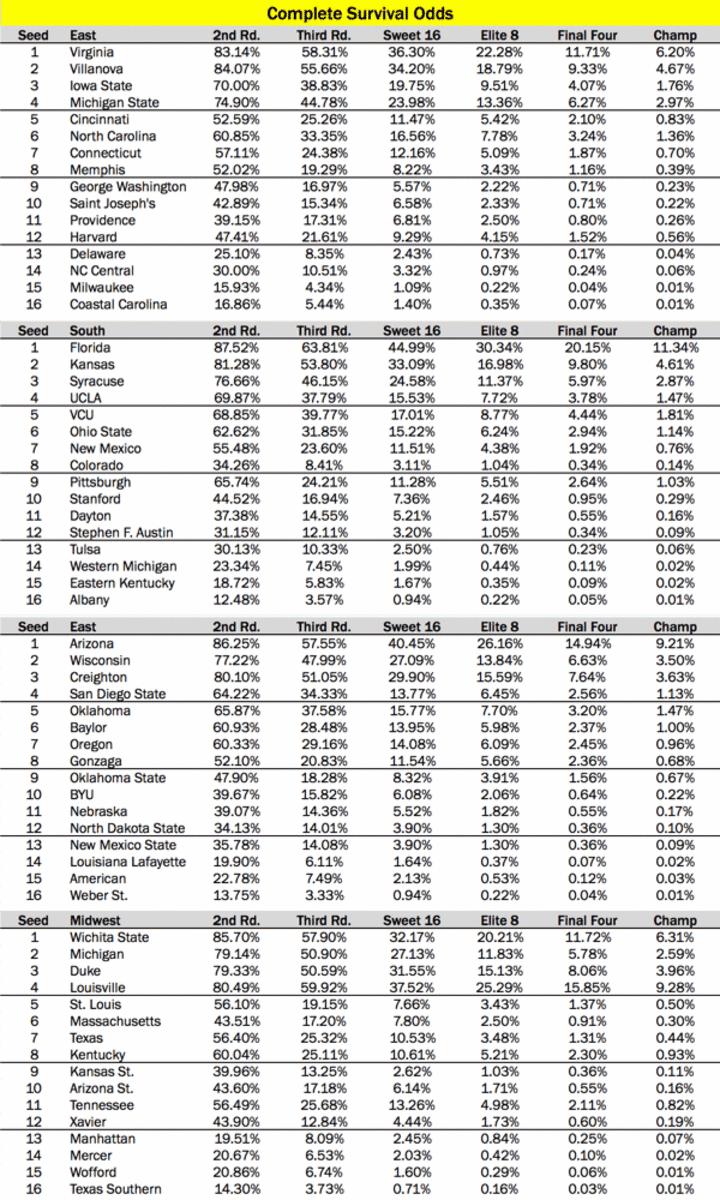
• As for upsets: The model forecasts that No. 6 UMass will lose to either winner of the No. 11 Tennessee/Iowa play-in game, although it's more confident in the Volunteers than it is the Hawkeyes. Due to the historical frequency of 12-over-5 upsets, our bracket tilted the tightest 12-5 matchup -- in which Cincinnati is just a 52.6-percent favorite over Harvard -- in favor of the Crimson. Otherwise, there's plenty of early-round chalk.
If you're interested in taking bigger risks, North Carolina Central is the most attractive No. 14 seed (the model gives it a 30.0 percent chance against Iowa State) and American is the best No. 15 (with a 22.8 percent chance against Wisconsin). Their survival, according to the model, is improbable but not impossible.
• The complete survival odds, by region, are as follows (note that the relative rankings are what's important, and that the advancement odds of 15s and 16s, due to the way the Cox model works, are unrealistically high):

