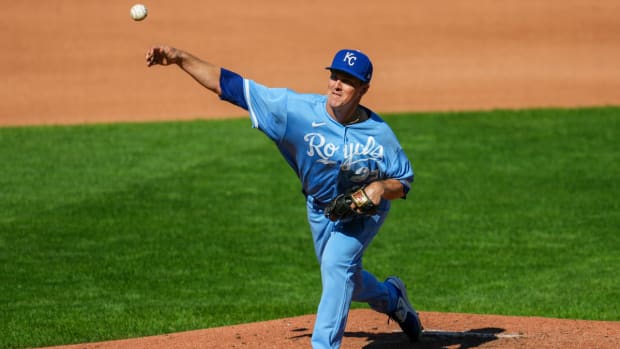
Have the Royals’ Starters Truly Been as Bad as People Think?
Before we get into the analytical part of this, let's go over some pitching philosophies. Everyone knows the basics: throwing first-pitch strikes, simplifying mechanics, being confident in "stuff," etc. but a team's strategy is a key portion of a pitching philosophy. To keep things simple, there are a couple of key strategies to consider.
One of these strategies is to overpower hitters with plus stuff or high velocity. This leads to more variance depending on the pitcher but typically, this is a high-strikeout approach that can lead to plenty of hard-hit balls. On the other side of that is the pitch-to-contact approach, which aims for weak contact consistently. Typically, this approach works for pitchers who aren't overpowering or don't have the best stuff — leading to lower K/9 but oftentimes with better control.
Other philosophies include which pitches are thrown, where they're thrown, and game plans for opposing teams. The Kansas City Royals are a pitch-to-contact team that heavily relies on fastballs (four-seam and sinkers) to get weak contact and to set up offspeed stuff. The issue with this is that the Royals lack control, leading to poor results.
For the analytical portion of this, we will be making comparisons to two other teams that have very similar stats to the Royals' starters. These clubs are the Washington Nationals and the St. Louis Cardinals. The cutoff focuses on pitchers with at least 10 games started.
(Writer's note: The Royals have six qualified starters compared to four on both the Nationals and Cardinals, so the Royals have a bigger data set by 10-plus starts.)
Team stats comparison
The pitchers for the Royals in question are Brady Singer, Brad Keller, Zack Greinke, Kris Bubic, Jon Heasley and Daniel Lynch. For the Cardinals: Miles Mikolas, Adam Wainwright, Steven Matz and Dakota Hudson. For Washington: Patrick Corbin, Erick Fedde, Joan Adon and Josiah Gray.
Let's begin with BB% and K%. The Royals have an 8.75 BB% with an 18.48 K%; the walk rate is league average while the strikeout rate is below league average. The Cardinals have a 6.85 BB% and a 19.75 K%. Their walk rate is above league average and their strikeout rate is slightly below league average. Lastly, the Nationals have a 10.33 BB% and a 20.43 K%, which are both below league average. This doesn't tell the whole story, but it does show which teams have control (or don't, to an extent).
While the Royals have an average BB%, they do have two outliers in their rotation. Both Singer and Greinke have been great at limiting walks — Singer with a 6.3 BB% rate and Greinke with a 4.5 BB%. Every other pitcher has a walk rate above 8% and all of Bubic, Lynch and Heasley have walk rates above 10%, which is in the 24th percentile or worse per Baseball Savant. Kansas City has two outliers doing the heavy lifting to make that team BB% look good. The K% for the Royals doesn't have an outlier, though, as Lynch is the only one with a league average K%. Everyone else is around 18% or below.
These three teams are pitch-to-contact rotations, so let's take a look and ERA and FIP. The Royals' starters have a 4.78 ERA with a FIP of 4.60, the Cardinals check in at 4.02 and 4.05, and Washington is at 5.62 and 4.98. Additionally, the ERA+ (adjusted for ballpark, 100 is average) for the Royals is 89 (11% below league average), St. Louis is at 103 and Washington is at 72. FIP is very important when it comes to pitch-to-contact teams, as the formula considers the three true outcomes (home run, walk, strikeout) to display how good someone is at preventing them. By this measure, the only team remotely good at doing that is the Cardinals.
This makes sense with the BB% and K% for every team, but we haven't looked at the last portion of FIP: HR/9. Kansas City has a 1.25 HR/9, St. Louis has a 1.09 HR/9 and Washington has a 1.49 HR/9. This furthers the fact that the Cardinals are good at limiting HRs, and it also shows that the Royals are decent at it as well. A key factor to the Caridinals' success in the rotation is their top-tier defense, whereas the Royals are average and the Nats are bad.
Let's take FIP to another level, as regular FIP isn't adjusted for ballparks or league averages. That is where FIP- comes in. FIP- is similar to ERA+, except it accounts for both ballpark and the league average FIP, where 100 is average and lower numbers are better. The Royals are at 116, the Cardinals are at 104 and the Nationals check in at 122. This means that all three teams are league average or below in each of their ballparks, which isn't a great look for the Royals because they play in the most pitcher-friendly stadium.
In summary, the Royals aren't the best at striking batters out, have outliers everywhere for their walk rate and are below league average in ERA+ and FIP-. What else has led them to this poor season, and how can they fix it?
Royals rotation quick deep dives
(Writer's note: Kris Bubic is not listed, as I did his deep dive last week.)
Greinke: The man with an elite 4.5% walk rate and a paltry 13.4% strikeout rate has had issues with hard-hit balls this season, giving up 42.3% of them while getting barreled 8% of the time. Greinke's main issue this season has been with every pitch except his "blazing" four-seam fastball (averaging 89.1 mph) and curveball. Both have a run value of minus-six while the rest of his arsenal is a positive four or five. Greinke, in his age-38 season, has been a solid arm in this underperforming rotation.
Keller: If we look at Greinke's season for comparison, Keller is just the better version of him. Keller walks more batters (8.6 BB%) and strikes out more batters (15.8 K%). The main difference between Keller and Greinke is in hard-hit% and barrel%, which are at 37.2% and 5.3% for Keller. Keller's slider has a run value of minus-seven while his fastballs — four-seam and sinker — have been hit often and hard. He's putting together an average season and could remain an anchor of the rotation if he isn't traded at the deadline.
Lynch: I covered Lynch in a deep dive earlier this season talking about his fastball being an issue. He has a walk rate of 10.1% with a strikeout rate of 22.3%, which leads the Royals. His K/9 has the biggest improvement from last year to this year (7.3 to 9.2), but every other per-nine stat has stayed the same. There's been good and bad development for Lynch since the last deep dive. Back then, his slider was at a minus-four run value and his fastball was at three. Now, his slider is at a neutral value and his fastball is at one, so there is regression and improvement in his pitches. The main issue for Lynch has been his luck, as his ERA is 5.05 but his FIP is at 4.23. This year has shown that Lynch has a lot of strikeout potential, but he still gives up too much contact and that could hurt him in the long run.
Heasley: This time using Lynch as a comparison, Heasley has a similar walk rate (11%) but he can't strike out batters the same (16.9%). He has a couple of issues this season with his pitches and the type of contact given up. In terms of run values, Heasley has no pitch in the negatives, which means that each of his pitches gives up runs at slow rates. He's in the bottom 7% of the league in hard-hit% at 46.1 and is barreled at a 9% rate. These are issues for Heasley, as he was known in his minor league career for limiting walks and getting a decent amount of strikeouts. Right now, he's at 4.5 BB/9 and just 6.9 K/9. Walking that many hitters without missing bats is a recipe for giving up a lot of hard contact and runs, although he has two especially bad starts that have hurt him in that regard.
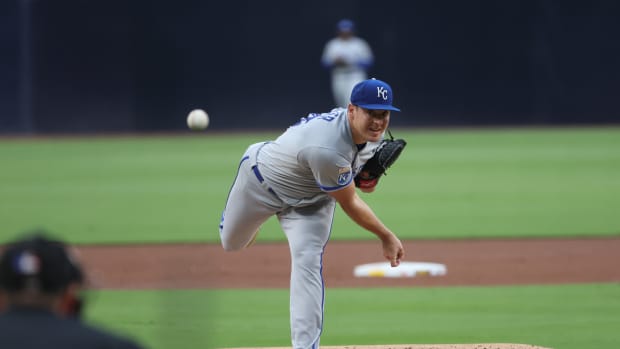
Singer: This year, Singer has been the Royals' best pitcher in his 12 games started vs. Keller's 18. He's putting up career-highs in K/9 (9.4) and BB/9 (2.3) and is limiting home runs (1.3 HR/9, which is around his career average rate). He has the best ERA and FIP in the rotation at 3.82 and 3.81, respectively, which is surprising considering he's been barreled at a 9.9% rate.
The issue with Singer this year has been his changeup — mainly the usage of it. Looking at run values, Singer's best pitches are his slider (minus-four) and his changeup (minus-two) but he's only using his changeup 9.3% of the time. The rest of the year is going to be interesting for him, as he's been really good but has a lot of variance from start to start. The key to his success for the rest of the year will be his changeup usage. He needs that decent third pitch to have a good career.
The Royals' starting rotation has cost some games that should've been won. The youth has had too many bad results mixed with good stretches while the veterans have been average for most of the year. The key issues for the rotation as a whole are issuing too many walks, not recording enough strikeouts and giving up too much hard contact compared to other teams.
The pitch-to-contact philosophy has helped the Royals in the past but this season, it's been more of a detriment due to high walk rates, low strikeout rates and average defense. If the rotation is to find success in the second half, it needs to limit walks and get more outs on its own. This is an important second half to keep an eye on, as most of the starters are still developing and have been starting to get their feet under them in the past couple of weeks.


