Pitcher Scouting: Why is Cashner's sinker more hittable this year?

Once a ball is put in play, there can be many different outcomes that the pitcher cannot control. Strikeouts, walks and homers, however, are completely at his command. And while line drives can go for outs, and bloopers can find some grass in the outfield, balls that are squared up generally result in hits more often than those that are not. That’s why we now have stats that isolate for strikeouts, walks allowed and homers allowed. Taken in conjunction with hard-hit rate, we have better tools for predicting pitcher performance than ever before.
Looking through the pitcher-controlled-event lens, there is no more interesting pitcher this season than Andrew Cashner. On the one hand, Cashner is missing more bats than ever this season, and limiting well-struck balls. His 21.2% strikeout rate and 8.39 K/9 would both be career bests by a wide margin since he became a full-time member of the San Diego rotation in 2013. His line-drive rate is 28th lowest among starting pitchers, and his hard-hit rate is down 0.5% from last season. On the other, his walk rate is up to 7.4% from 5.7% last year, and his HR/FB ratio is 14.6%, more than double what it was in 2014.
Hitting Report: Will Steven Souza's power turn into 30 homers this year?
By some measures, Cashner has proven that he has the foundation to be a top-20 fantasy starter. Other factors, however, are undermining all the good he’s doing by missing bats and limiting solid contact. Cashner has also been a bit unfortunate, amassing a .327 BABIP and 61.2% strand rate thus far in 2015. Both of those are likely to trend in his favor over the rest of the season, especially the strand rate. At the same time, one surefire way to keep fewer runners on base than the stats suggest you should is by letting balls sail out of the yard. The walks may be a problem, but it’s the homers that are really foreclosing what should be Cashner’s increased fantasy production this year.
The advanced metrics say that Cashner has been unlucky with the longball this season. While his ERA is up at 4.35, his xFIP, which normalizes HR/FB ratio based on fly-ball rate, is 3.72. Essentially, that means that Cashner has allowed more homers than he would in a neutral setting, based on how many fly balls and hard-hit balls he has surrendered this season. The raw numbers are pretty ugly. Cashner has already surrendered 13 homers in 89 innings this season. He allowed seven in 123 1/3 frames last year, and 12 in 175 innings in 2013. The first place to look for the answer is his repertoire. You’ll see, courtesy of this chart from Brooks Baseball, that he has not made any significant changes in usage rate from last season to this season.
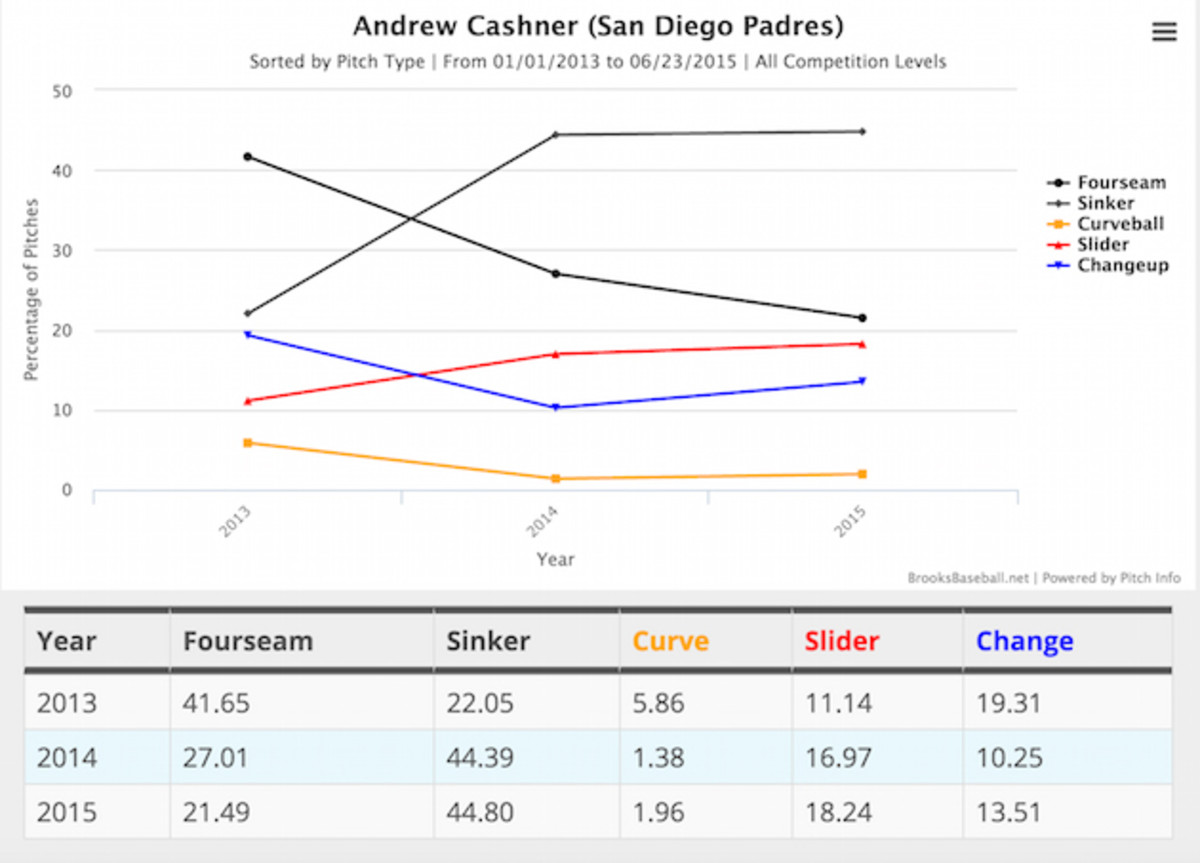
Cashner’s four-seamer and sinker traded roles last year, but the usage has remained flat this season. He has thrown a larger percentage of changeups and sliders this year, and that could be a clue as to what is ailing Cashner. The following charts show the results for every pitch in Cashner’s repertoire. The first one is from 2014, and the second is for this season.
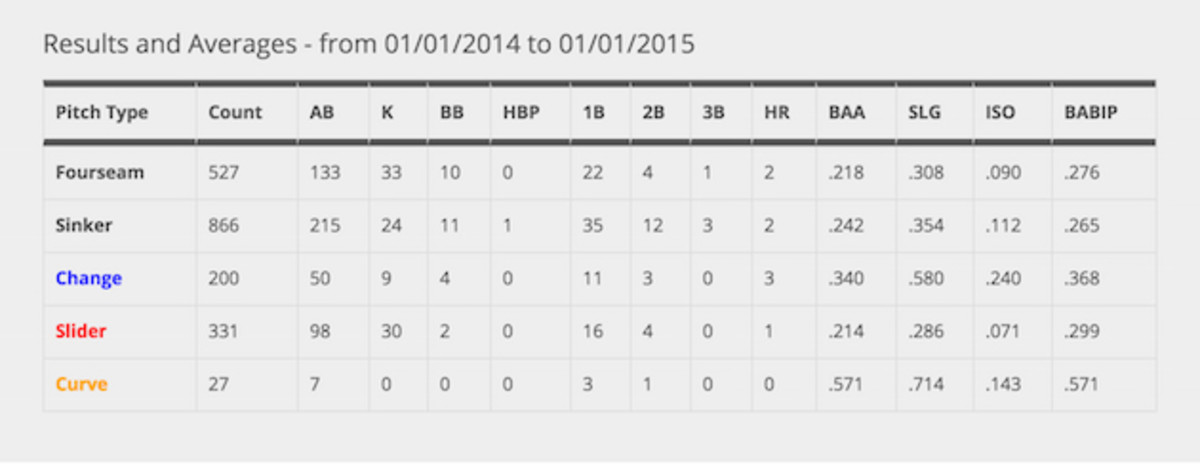
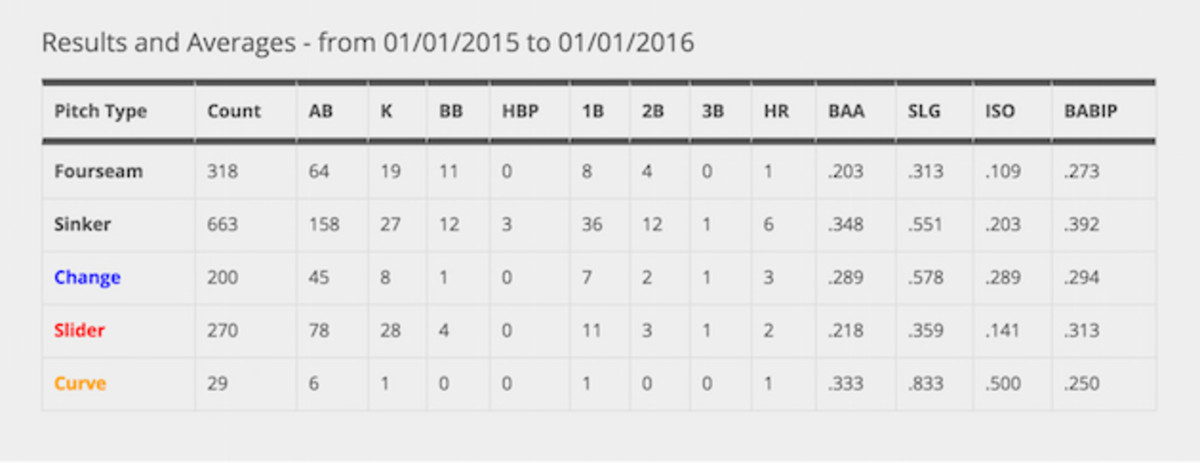
Now we’re really getting somewhere. Cashner’s sinker was great last year, holding hitters to a .242 batting average, .354 slugging percentage and two homers. His changeup, however, was terrible, resulting in a .340 average and .580 slugging percentage with three homers. This season, the change has been just as bad, but the sinker has been his worst offering. Hitters have racked up a ridiculous .348 batting average and .551 slugging percentage against the pitch Cashner throws more than any other. He has surrendered six homers and 19 total extra-base hits on the sinker, as well. Given those numbers, you probably won’t be surprised to learn that lefties are slashing .283/.369/.555 with 10 homers against him this season.
• MLB Power Rankings: Cardinals leading amid truly dominant season
Is there anything specific about Cashner’s sinker this year that’s making it more hittable than last season? Is it a simple case of the league adjusting to him? Is he getting unlucky? Is it some combination of all of the above? I watched video of all six homers he has allowed on the sinker this year, and compared them to the offering from last season. Here is what I found.
Before getting to the video and pictures, it must be said that the sinker is moving less than it did last year. Here are those charts, with horizontal movement first, and vertical movement second. Negative horizontal movement indicates away from a lefty.
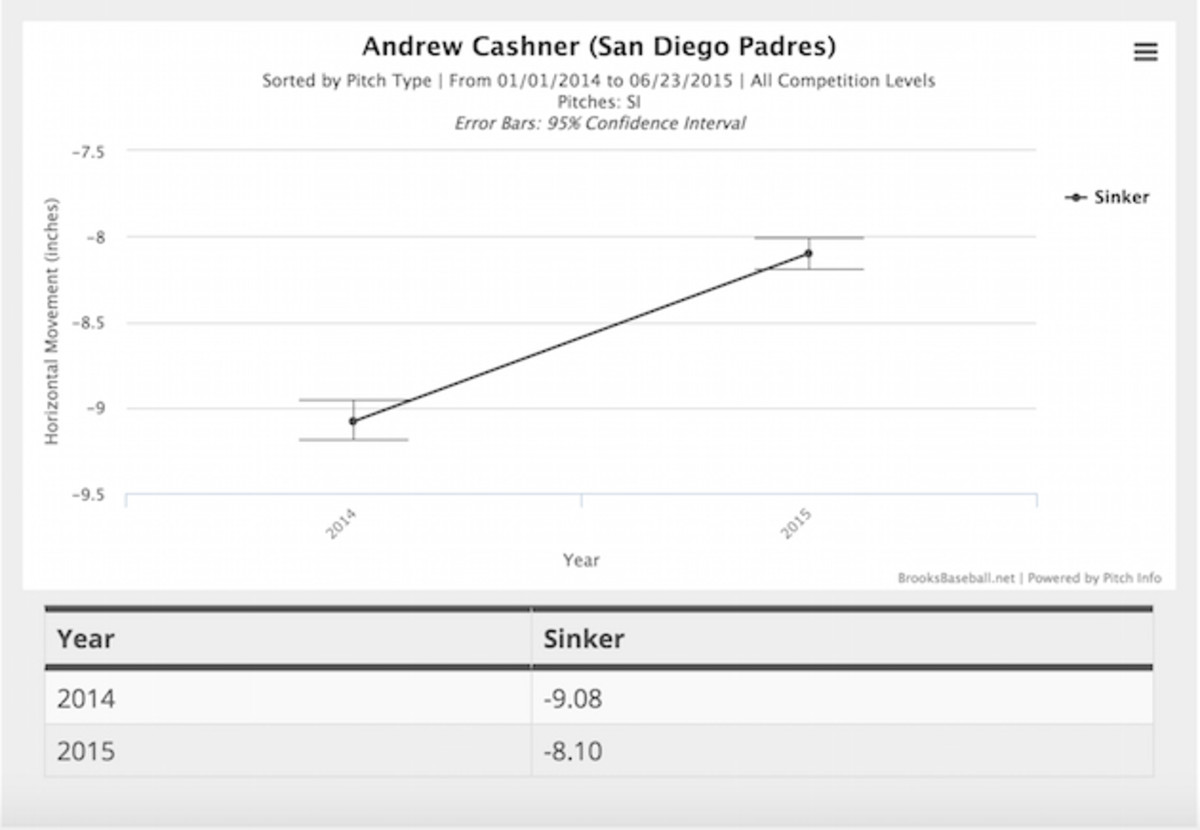
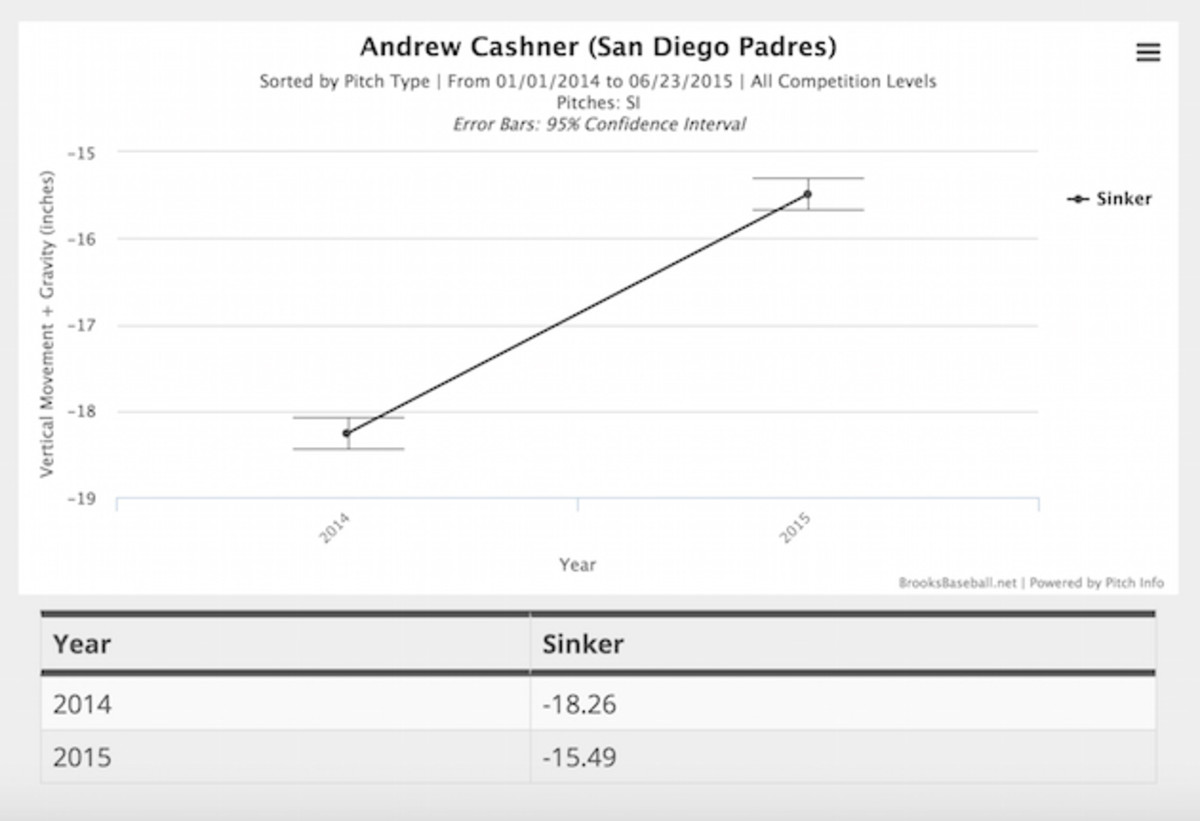
First of all, five of the six homers launched off the sinker have been by lefties. The only righty who took him deep on the pitch was Zack Cozart. Lefties were, of course, better against the sinker than righties in 2014, but they still hit just a manageable (for Cashner) .266 with a .426 slugging percentage. This year they’re hitting .381 and slugging .714, suggesting that they’re seeing the pitch much better. That is, in fact, what’s happening.
The following is from a June 2014 game against the Nationals. Cashner threw three sinkers to the left-handed hitting Denard Span, the first batter of the game. The first two were called strikes, and Span flew out weakly to left on the third one. Here’s video of the first pitch.
Cashner is basically upright as he lets the pitch go and doesn’t fall off at all to the first base side of the mound. That helps him keep the proper arm angle, allowing him to get on top and finish the pitch. The result is a taken strike on the outer third of the plate. He looks just the same on the next pitch.
Here are a few pertinent screenshots.
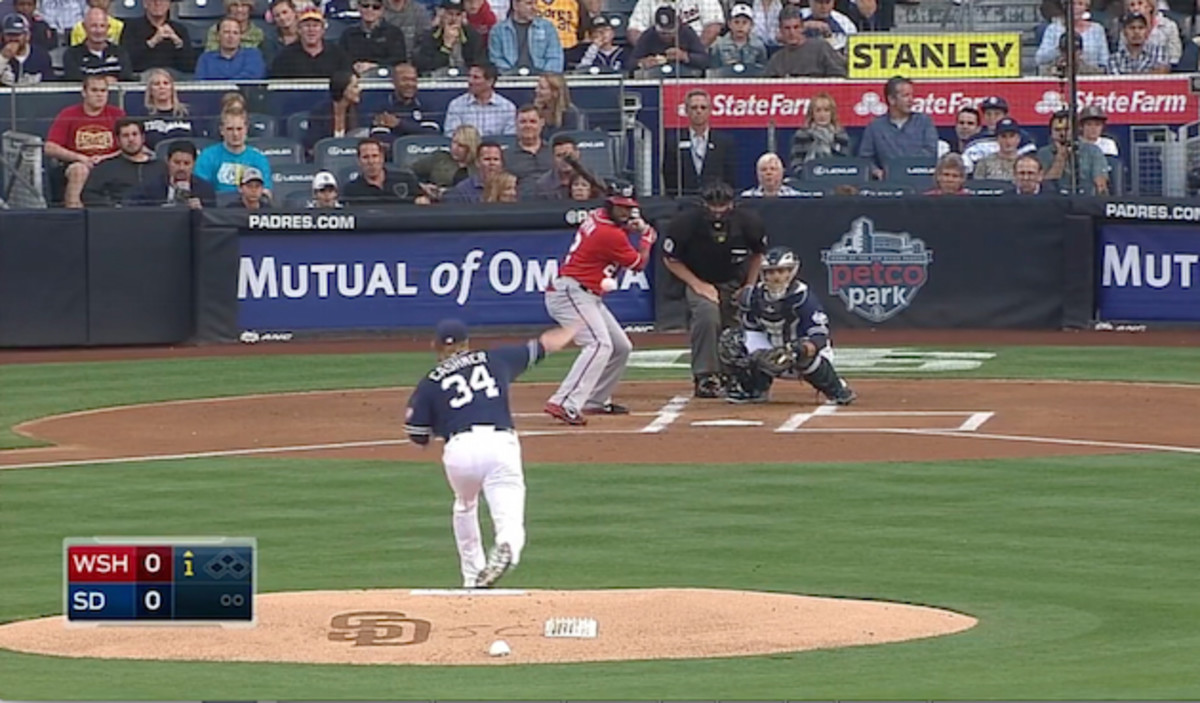
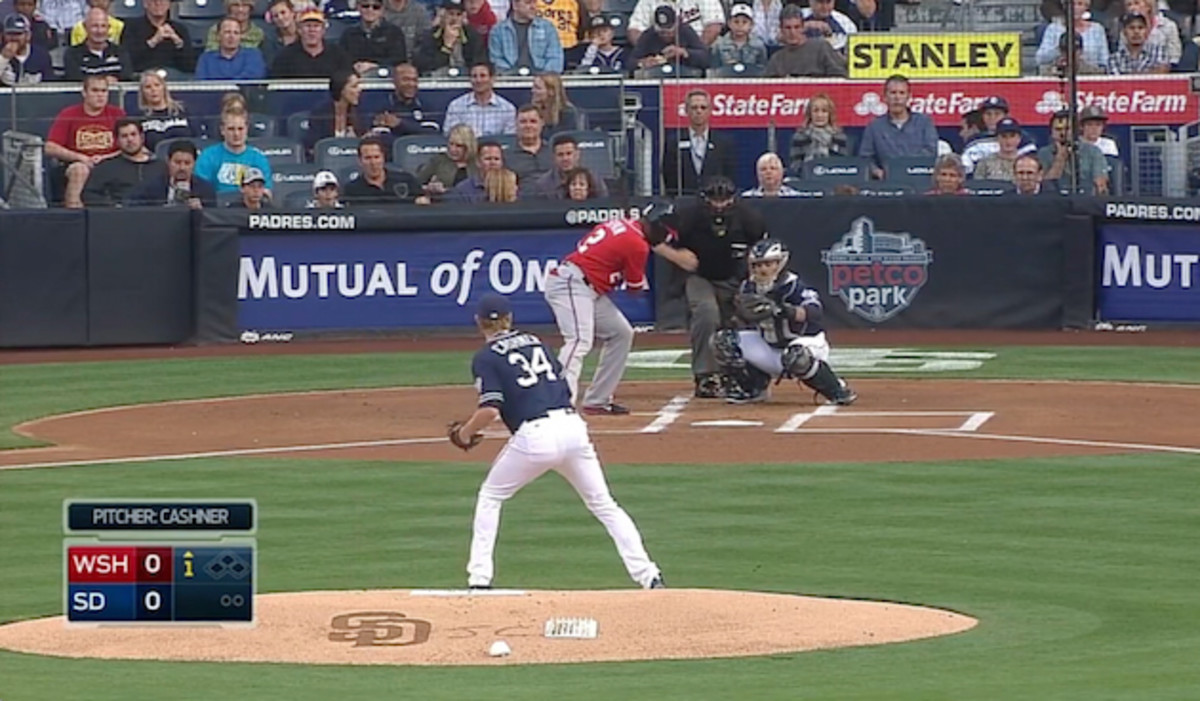
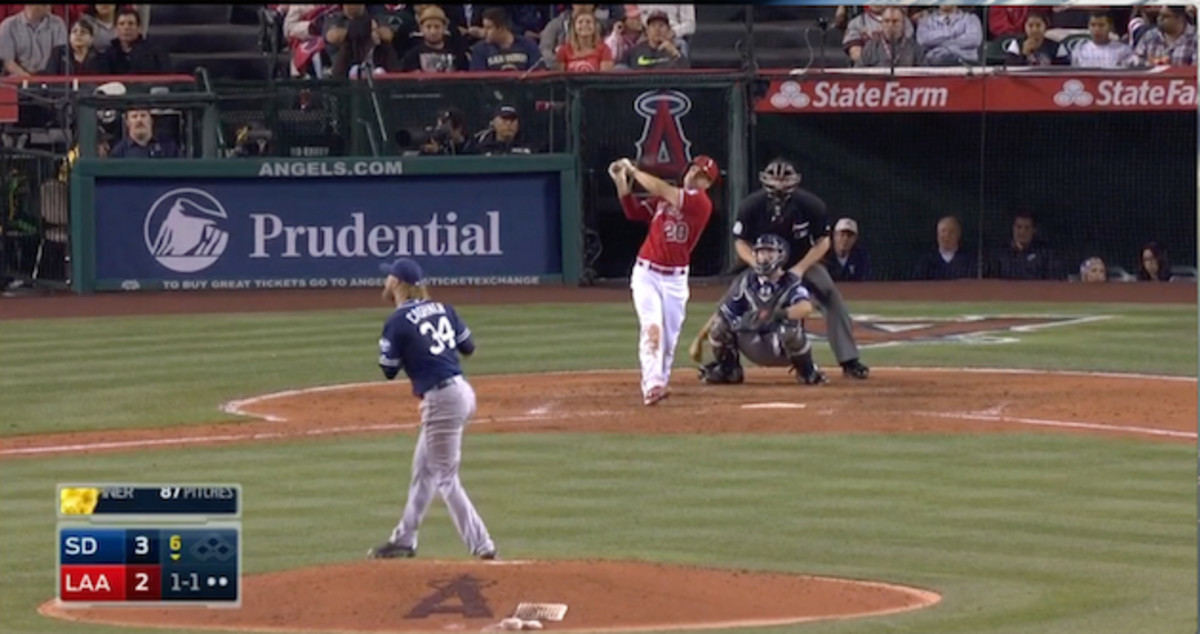
The first freeze frame makes it easier to see his upright posture as he releases the ball and the arm angle that keeps him on top of the pitch, while the second one shows him square to the plate as his drive leg lands. Let’s compare that to an at-bat against Matt Joyce just a few weeks ago, in which Joyce took Cashner deep into the Anaheim night.
By time Cashner releases the pitch, he’s not out in front with his chest over his kick leg, but leaning to his left. He falls way off to the first base side after releasing the pitch, signaling that his mechanics are out of whack. With his body sped up, his arm drags, forcing him to get underneath the pitch and leave it elevated. Joyce takes care of the rest.
Here are the key screenshots.
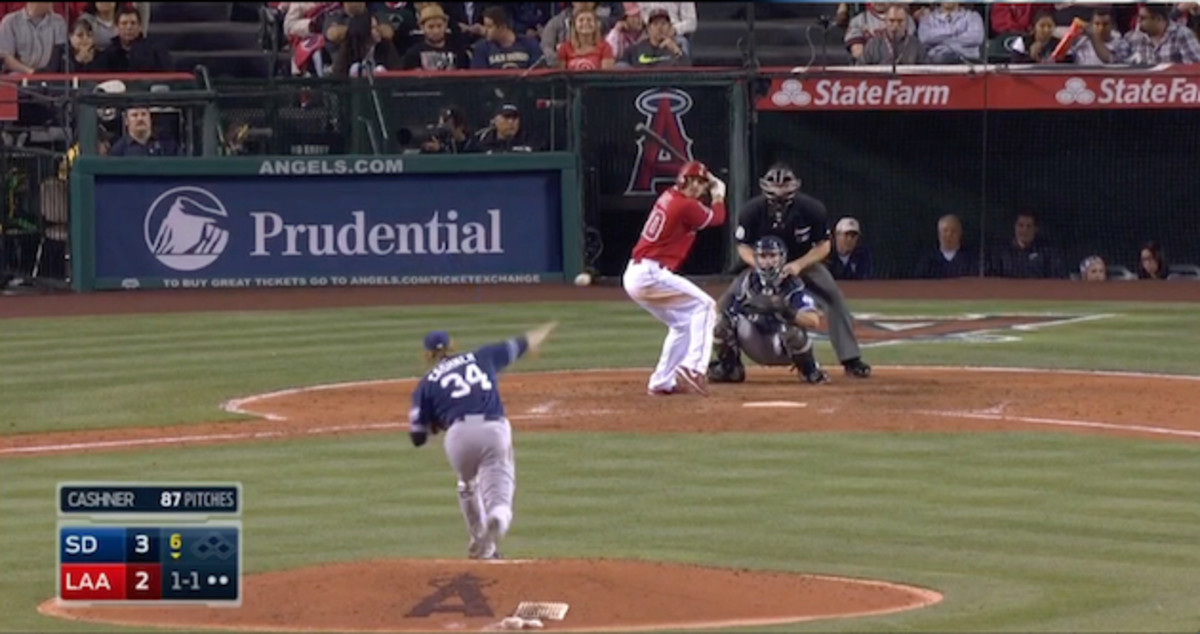
And here they are in comparison to last year.


Time and time again, this is what we’re seeing from Cashner when he gets taken deep in 2015. Adrian Gonzalez got to him three times in his first start of the season, the final two of which were on the sinker. The video there tells the same story as the Joyce bomb.
And here’s Cashner surrendering a homer to Freddie Freeman. While the finish is better on this offering, he’s still too sped up, forcing him to drag his arm and leave the pitch up.
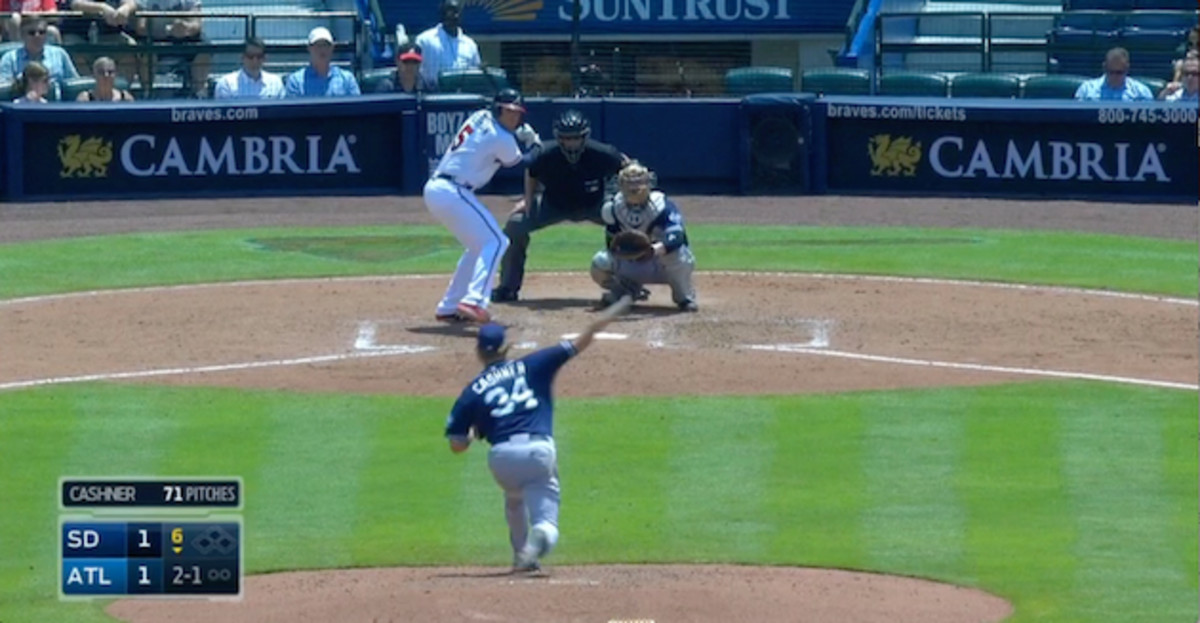
The good news for Cashner is that he’s not leaving a greater percentage of his sinkers in vulnerable spots than he did last year. This season, 39.5% of his sinkers have been at the letters, belt or right down the middle of the plate at the knees. Last season, he was at 42%. The problem is that this year, hitters, especially lefties, aren’t missing those pitches. The additional good news is that this could be as easy as a mechanical fix, especially for a veteran like Cashner. The fact that he’s striking out more batters makes me sanguine that he can tweak his delivery to keep the sinker down more than he has this season. If he can do that, his ERA will likely jibe more closely with his xFIP. Cashner has it in him to be a low-3s ERA pitcher for the rest of the year. He’s a bit of a risk, but given the likely low price tag attached, it’s worth checking in on him in your fantasy league.
