For Girardi, Yankees' shift woes may be behind call for ban on strategy

The baseball world will never know whether Yankees starter Nathan Eovaldi would have completed his no-hit bid on Monday night against the Rangers if not for a defensive shift, but if it were up to manager Joe Girardi, repositioning his defense to that degree wouldn't have been an option. Prior to Tuesday's game, New York's skipper had some interesting thoughts about shifts, telling reporters, "It is an illegal defense, like basketball. Guard your man, guard your spot. If I were commissioner, they would be illegal." Girardi, though, conceded he wouldn't stop using shifts so long as the tactic remains legal.
Girardi's frustration is understandable, but only because the Yankees have had considerably less success when it comes to shifting than any other team, on both sides of the ball. They’re among the game’s most frequent shifters, but they have far less success than other teams once they deploy them. Meanwhile, their hitters face more shifts than any other team but are suppressed to a much greater degree when they put the ball into play.
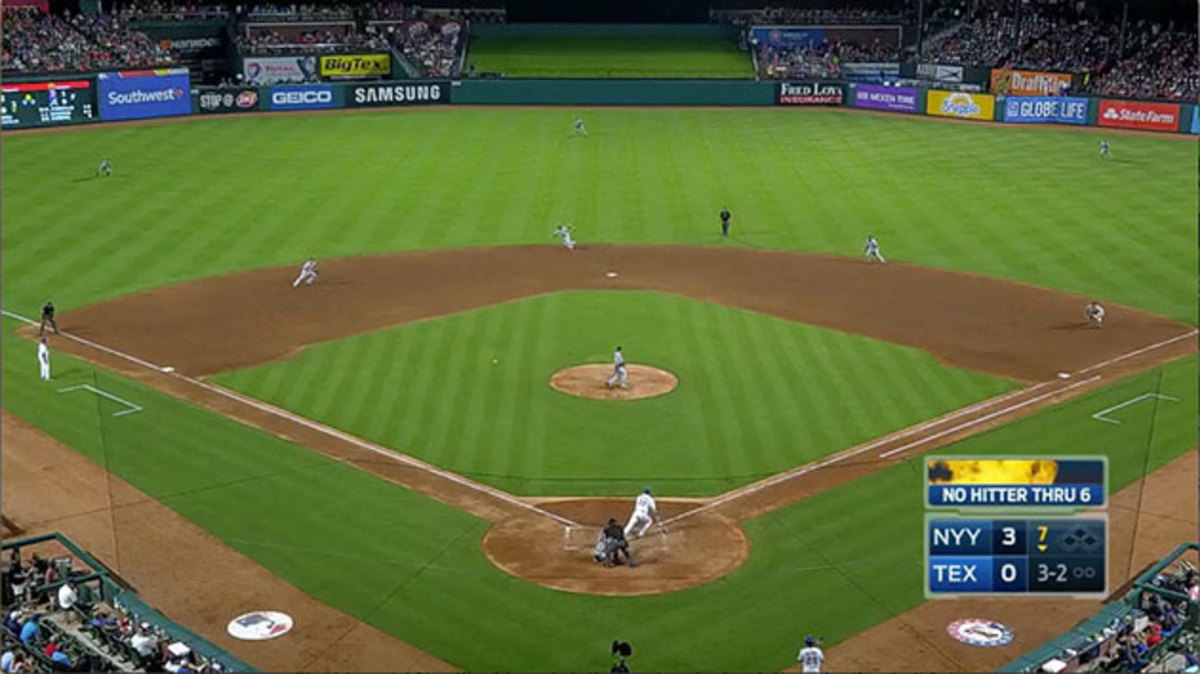
As to the specifics of Monday night: Eovaldi's no-hit bid ended at the hands of hot-hitting rookie Nomar Mazara, who lashed a grounder to the left of second base, where shortstop Didi Gregorious normally would have been playing. Gregorious was instead positioned almost straight up the middle behind the second base bag, and the ball trickled between him and third baseman Chase Headley, who was positioned halfway between second and third. Here's a screenshot from the Rangers' Fox Sports Southwest feed as it picked up the ball's path:

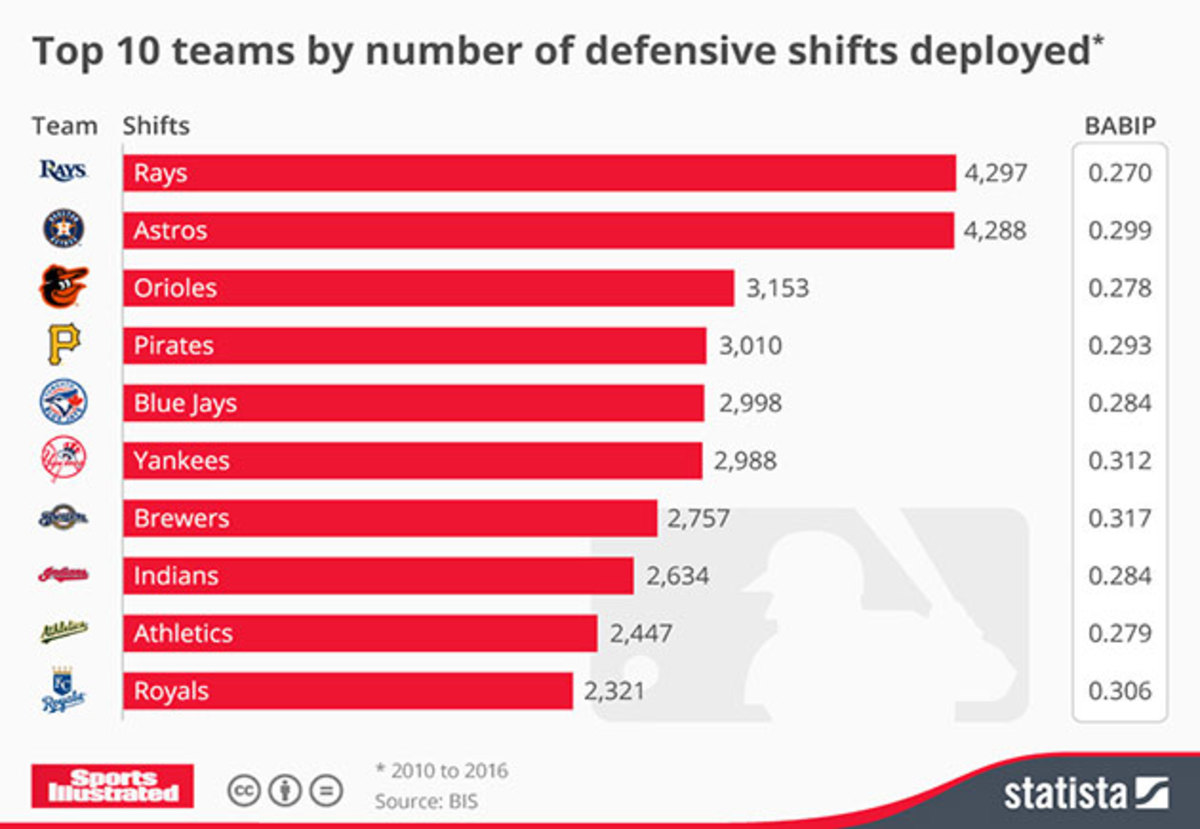
Via FanGraphs, a wealth of shift data from Baseball Info Solutions is now freely available, making it easier to track the strategy's growth and success. I'll get to the larger trends in a moment, but first, it’s worth a closer look to show how hapless New York has been, at least according to the data from BIS. Since 2010, Girardi has deployed shifts for 2,988 balls in play, more than all but five other clubs, but his team has allowed the majors' fourth-highest BABIP in that context at .312:

Girardi's troops are practically laughingstocks relative to the other frequent shifters; the other nine teams above have combined for a .287 BABIP when shifting, 25 points lower than the Yankees' mark. For 2015 and '16—years in which New York moved on from the aging, oft-injured Alex Rodriguez/Derek Jeter combination on the left side of the infield in favor of the more nimble Headley and Gregorius—the Yankees are fifth in total shifts, but their .323 BABIP in such instances is the majors' highest by 12 points!
• MORE MLB: Hardthrowing Syndergaard is physical marvel for Mets
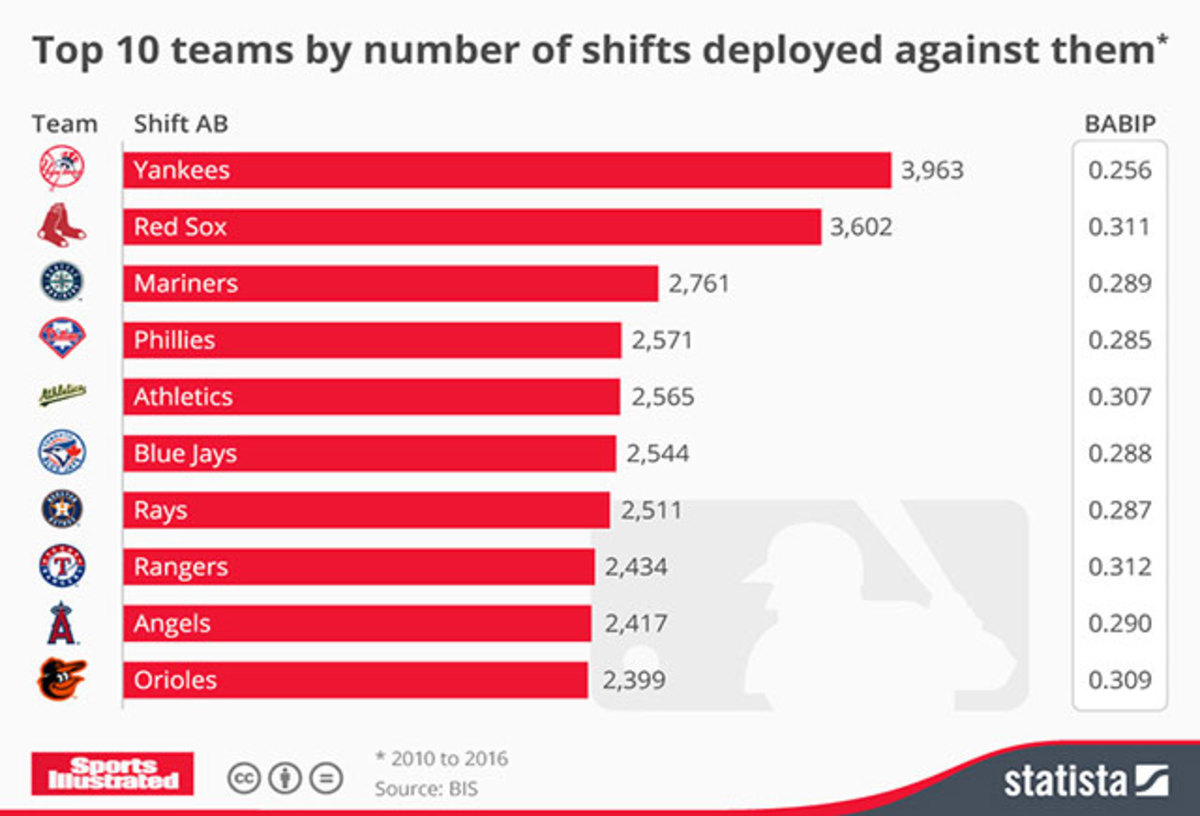
Meanwhile, on the other side of the ball, New York's batters—a group that includes frequent shift candidates Brian McCann, Mark Teixeira and Carlos Beltran (respectively fifth, seventh and 27th in total shifts against since the start of 2010)—have been shifted against more often than any other team over both the 2010 to '16 and '15 to '16 ranges. And what do you know, their BABIPs bring up the rear, with an MLB-low .256 mark over the longer range and .261 over the shorter one (note that this does not count when players beat the shift by homering). Here's the 2010 to '16 data:

Hence Girardi's frustration. To his chagrin, however, the strategy is not illegal. Rule 5.02 (c) explicitly states, "Except the pitcher and the catcher, any fielder may station himself anywhere in fair territory," which allows not only the type of shifting where a shortstop or even a third baseman moves to the right of second base but also more basic moves, such as playing in to avoid the bunt, guarding the lines in the late innings, or bringing in an outfielder to form a five-man infield (generally a desperation move to prevent the tying or winning run from scoring).
The True Story: Rockies' Trevor Story cools off, but future is bright
While the league and the players' union could take up action to outlaw shifting if there were a consensus toward doing so—as they've done regarding collision rules at home plate and second base over the past few years—it doesn't sound as though that's about to happen, despite the occasional grousing from executives, managers, coaches, players, media and fans. Recall that shortly after taking over from Bud Selig in January 2015, new commissioner Rob Manfred made waves throughout the game by floating the idea of banning shifts as a means of bolstering offense, which in the previous season had dipped to its lowest level since 1981. Almost immediately, he had to walk back the statement due to the backlash, telling ESPN's Jerry Crasnick, "When I talked about the defensive shifts, I let myself get into a situation where I speculated about a change I wasn't serious about."
It's overly simplistic and inaccurate to lay the blame for declining scoring rates at the feet of defensive shifts, as becomes clear when delving deeper into the BIS data at FanGraphs. Here's a look at the growth of the trend and its success rates:
year | shifts | % bip | shift babip | no shift babip | dif | overall babip |
|---|---|---|---|---|---|---|
2010 | 3,323 | 2.6 | .306 | .293 | +.013 | .293 |
2011 | 3,065 | 2.4 | .289 | .291 | -.002 | .291 |
2012 | 6,176 | 4.9 | .301 | .293 | +.008 | .293 |
2013 | 8,545 | 6.7 | .291 | .294 | -.003 | .294 |
2014 | 14,972 | 11.8 | 297 | .295 | +.002 | .295 |
2015 | 24,486 | 19.5 | .287 | .298 | -.011 | .296 |
2016 | 4,522 | 29.5 | .287 | .298 | -.011 | .295 |
Shifts were used eight times as often in 2015 as in '11, accounting for nearly one out of five balls in play (again, note that these totals omit shifts that don't result on balls in play, such as homers and strikeouts). One-eighth of the way into the 2016 season—yes, that's a small sample size—their use has skyrocketed to the point of accounting for nearly three balls in play out of 10, but the sharp increase hasn't changed outcomes substantially. The difference in batting average on balls in play has remained consistent with last season's 11-point gap in favor of shifting, but that still only amounts to the loss of roughly one hit per 100 balls in play. The majors' overall BABIP is down just one point relative to last season—right where it was in the low-scoring 2014 season (4.07 runs per game) that triggered Manfred's comments, but still above any of the higher-scoring seasons that preceded it, even with the increasing use of shifts:
season | shift dif. | overall babip | k% | r/g |
|---|---|---|---|---|
2010 | -.013 | .293 | 18.5 | 4.38 |
2011 | .002 | .291 | 18.6 | 4.28 |
2012 | -.008 | .293 | 19.8 | 4.32 |
2013 | .003 | .294 | 19.9 | 4.17 |
2014 | -.002 | .295 | 20.4 | 4.07 |
2015 | .011 | .296 | 204 | 4.25 |
2016 | .011 | .295 | 21.4 | 4.26 |
Note that I've added the majors' ever-increasing strikeout rate, which has helped to reduce scoring as well. Within the limited sample of six full seasons (excluding 2016), that MLB-wide strikeout rate has a -.69 correlation with scoring rates. That is to say that while the strikeout rate rises, the amount of runs scored decreases, but that only helps to explain about 48% of the year-to-year variance in scoring. Over that span, overall BABIP has correlation of -.49, which explains only about 24% of the variance in scoring. The rate of shifts on balls in play has a similar -.46 correlation, explaining only about 21% of the variance. All of that is to suggest that increasing strikeout rates are having a greater impact on scoring rates than increasing shift usage.
(Here it should be pointed out that the relationship between strikeouts and scoring becomes more clear across a greater number of seasons. From 2001 to '15, the correlation between the two is a very strong -.90, while over the '06–15 range, it's an even stronger -.93, accounting for 88% of the variance in scoring rates. For overall BABIP as it relates to scoring, expanding the sample muddies the waters, producing a correlation of .11 for 2001 to '15, but .68 for '06 to '15. Alas, we don't have comparable shift data to compare for either of those larger ranges).
Rich Hill's journey back to being a successful MLB starter full of curves
What the rising shift rates and fluctuating BABIP differentials suggest is what one might suspect: The strategy is an imperfect one, with teams still searching for the secrets of when and how to use them. One trend worth keeping an eye upon is the impact of non-traditional shifts. BIS defines traditional shifts as those with three infielders on one side of the field ("Full Ted Williams Shift") or two players significantly out of position, or one infielder playing deep into the outfield (the last two of which count as “Partial Ted Williams Shifts"). A non-traditional shift is anything that deviates from those examples. In 2014, such non-traditional examples accounted for 11.2% of all shifts but had a BABIP of .352 compared to .290 for traditional shifts. Despite that lack of success, non-traditional use skyrocketed to 27.6% in 2015, the highest rate of the '10 to '16 range, and BABIP in such instances dipped to .279, compared to .290 (again) for traditional shifts. This year, non-traditional use is back down to 16.3%, with a .287 BABIP compared to .288 in traditional shifts. It's possible that teams may be getting better at using batter tendency data as to when to think even further outside the box for such shifts, but that's just speculation.
The Yankees, however, may want to re-think their approach when it comes to shifting, because they're simply not doing it well. Veteran hitters such as Beltran, McCann and Teixiera aren't likely to make radical changes to their approaches this late in their careers, and to be fair, the pull-hitting tendencies that attracted the team to them—primarily Yankee Stadium's short porch in rightfield, an inviting target for the lefty-swinging McCann and the two switch-hitters when they swing from that side of the plate—generally have a greater payoff regarding the power numbers they produce. While New York's offense has been dreadful this year, the team ranked second in the AL in scoring at 4.72 runs per game last year and was fourth in homers with 212.
Going forward, general manager Brian Cashman and the rest of the organization may want to target batters that do better jobs of using the whole field, whether in drafting and development or free agency. For the moment, though, the greater payoff may come with better defensive alignment. The Yankees were drawn to Gregorius and Headley in part because of their glove work elsewhere, and likewise for newly acquired second baseman Starlin Castro, whose defense improved upon moving from shortstop to that spot in a small sample of late 2015 games for the Cubs. There would seem to be little reason why those players can't help New York improve in this area, but whether that happens by shifting less often or using their data differently is for the likes of Girardi and Cashman to decide.
