Fantasy Strategy: When a player struggles, when is enough enough?

One of the toughest aspects of managing a fantasy baseball squad is determining when to adhere to the mantra of practicing patience and when to either cut bait with a struggling underperformer or trust an overperformer to continue to excel. Unfortunately, there is no cut-and-dry method for attacking the issue. Much of the call is from the gut, but there are some hints that might point you in the right direction.
By this point, most everyone is familiar with the acronym BABIP, or batting average on balls in play. With a few exceptions, the BABIP for pitchers clusters between .290 and .310. If his BABIP is significantly below that level, the common assumption is he has been fortunate with respect to hit rate lowering his ERA which is expected to correct and climb. If his BABIP is high, once it corrects, his ERA will drop. With respect to hitters, they establish their own baseline. If the hitter's BABIP is below normal for them, the conclusion is he has been unlucky which likely has also negatively impacted their scoring and knocking in runs, as well as reducing their opportunities to run. Once their BABIP regresses upward, the associated production will improve. If their BABIP is high, their batting average will likely soon come down as the BABIP comes down. Recent advancement in data collection and analysis with respect to the nature of batted balls in terms of ground balls, fly balls and line drives are helping us narrow this generalization down a bit further to make it more useful, but for a quick and dirty mode of analysis, looking at BABIP can be useful unto itself.
Another metric that can be helpful when analyzing player's performance in a small sample is their HR/FB rate or percentage of fly balls that land on the other side of the fence. Similar to BABIP, a pitcher's HR/FB usually settles around the same number for all, in the neighborhood of 10%-11%. So if a pitcher is allowing the same number of fly balls but has an elevated HR/FB, he can be considered unlucky and he should seeing better days ahead as the home runs decrease. Conversely, his ERA may be artificially low as he is enjoying a fortunate stretch where not as many files become big flies as normal. For a hitter it is a little trickier as there is a bit more skill involved with hitting a homer as compared with whether a batted ball goes for a hit, but if his HR/FB rate is low and his doubles rate is high, chances are a few of those doubles will become homers in the coming days and weeks.
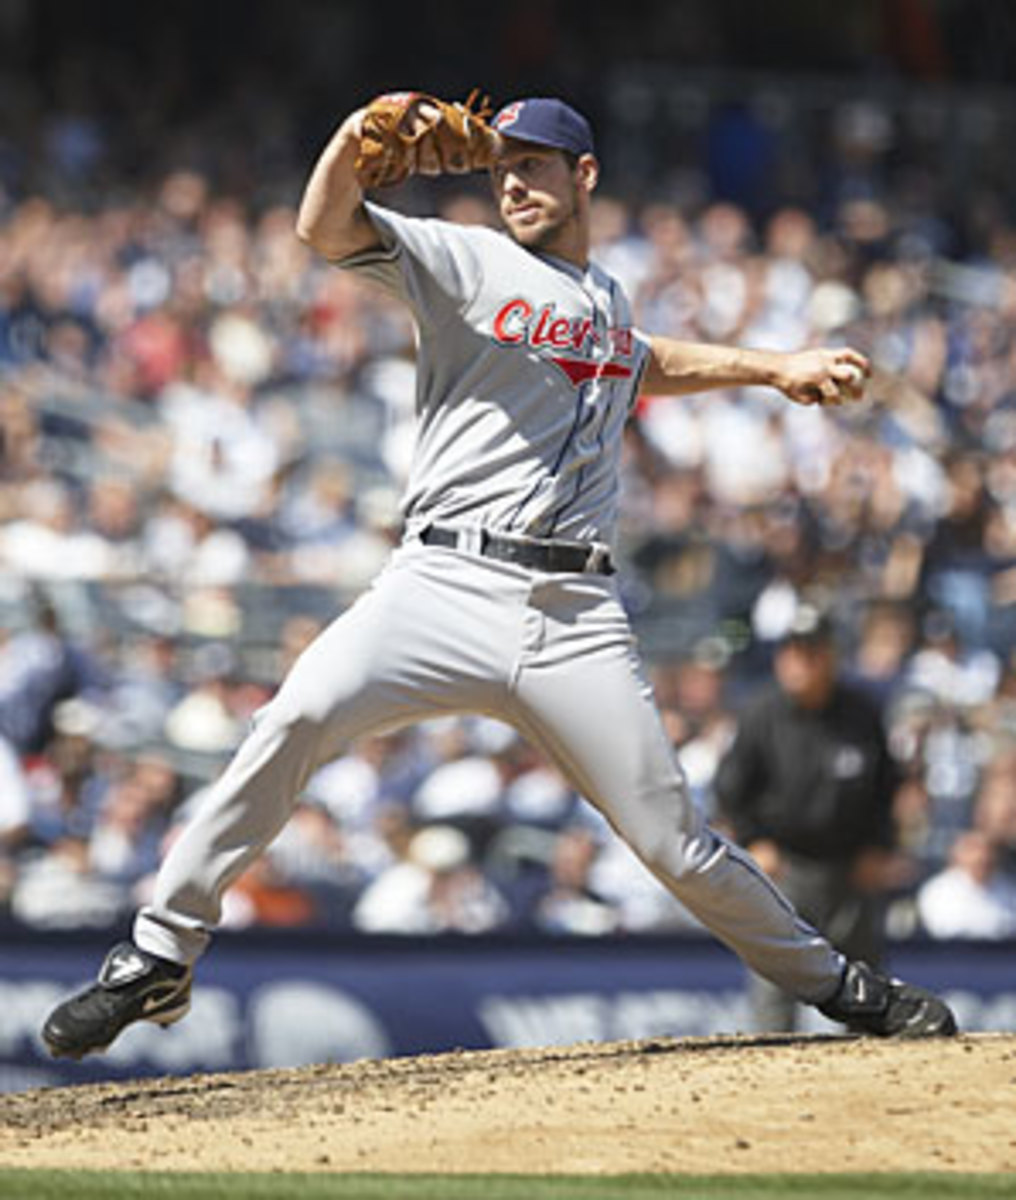
So far, the focus has been trying to determine how much of a player's performance, good or bad, is dependent on luck. But the real Holy Grail in player analysis would be the ability to decide if a change in a skill set is sustainable if it is positive, or likely to continue if it is negative. This time last season, Cliff Lee was the talk of the town. How many of his owner's dropped him or sold high, expecting his improved strikeout and walk rates to decline as well as the luck factor normalizing? The answer is probably quite a few. Right now, many of owners of David Ortiz are agonizing over what to do, as Big Papi is producing more like Big Poopi. Have his skills declined or will he rebound?
It is virtually impossible to know whether an improved or declining skill set is real or whether it will bounce back, but we do know the primary metrics to focus upon are strikeouts and walks, for both hitters and pitchers. A player whose BABIP is low but is striking out at a normal pace may appear to be slumping, where in fact he is just unlucky. But a hitter whose BABIP is normal but is striking out at an elevated rate is mired in a true slump. The trick is now to determine if the slump is just a phase or if the player's bat speed has slowed or his ability to recognize pitches has declined. For pitchers, you must decide if a change in strikeout or walk rates is real, or will he soon revert back to career levels. Owners of Jarrod Washburn are asking themselves that question right now as they know his lucky hit rate will soon normalize, but if he is able to maintain his present skill level, he is a better pitcher than projected in 2009.
In general, it is best to use history as a guide as opposed to a one-month sample. The axiom, "I would rather be wrong for the right reasons than right for the wrong reasons," is a cute way of expressing that. The idea is more often than not, you will be right if you use history as your guide. For every guy you miss out on, there are many others you got right.
But it is human nature to take some chances. Sometimes we are forced to do so based upon circumstances surrounding our team. So we make a guess, hopefully of the educated variety. Here are a couple of things to consider while venturing that guess.
In general, there is a reason for an improvement or a decline in a skill set, and this improvement or decline manifests in multiple ways. A pitcher can develop a new pitch, change mechanics or alter his approach and throw more strikes. A hitter can adjust his swing or change his approach. Injuries can also play a part. A player may have been hurt but still playing, impacting his skills, but now he is completely healthy. Or a player can be hurt, negatively impacting his skills. Usually, if a pitcher has improved his skills, it is evidenced by both an improved walk and strikeout rate or sometimes by inducing more ground balls. There are some pitchers that improve by striking out fewer hitters, but also walk a lot fewer and let their defense take care of the rest. Similarly, a batter with improved skills will strike out fewer times and hit more line drives, or perhaps walk more and hit for more power.
The take home lesson is if you decide to rebuff history and attempt to identify players with improving skills to target or declining skills to dump, look for a tangible reason for the change in skill set then look for a few different ways the skill change is reflected. First eliminate the luck factor by looking at BABIP and HR/FB. Then look at strikeout and walk rates and decide if there is a plausible explanation for the change and if this change can be observed in multiple ways.