Pitcher Perfect: Reach for the Cy

Since we're at the end of the season, let's do our annual review of who was truly the most valuable pitcher in each league, and in a perfect world would receive the Cy Young award.
When evaluating the candidates for the Cy Young, I ask three questions:
1. Did he have a good season compared to the league?2. Was the pitcher valuable to his team?3. Did he pitch well when it counted?
That first question is answered by looking at who had the best results in their respective leagues. This is the true absolute stats in a vacuum (there's a movie idea as good as Snakes on a Plane). Voters usually put a lot of emphasis on pitching wins, but in recent years they've put in perspective what statistics are in the pitcher's control versus those that are defense- and team-dependent. And as team dependency goes, a win is tops on the list. So I look at wins, ERA and WHIP, but relative to the league and the pitcher's team (see below).
The second question requires that we look at the pitcher's results compared to the other starters on his team. That allows us to see how well he has done with the same defense, offense and bullpen that at least four other starters have had. This can help a pitcher on a bad team or penalize one on a good team. In the latter situation, I give the benefit of the doubt. I will also look at wins the pitcher had taken away because of blown saves.
The last question is harder to quantify than the previous two, but it has to do with how well he has done in meaningful games, which usually occur in September. Granted, the Royals and Pirates meaningful games are over by Memorial Day (or sometimes Mardi Gras), but this can help the pitcher on the good team who is penalized by question two.
It's hard to judge apples and oranges, especially when the orange payroll is four times that of the apples. So rather than letting the stats dominate all the decisions, I keep things in context with the league and the season. That means pitchers on bad teams don't get penalized. Relievers are also considered, but they had to be closers and had to have a stellar season. I do keep an eye open for middle relievers, but I've never seen one that merited a Cy Young.
Pitchers that don't depend on strikeouts have just as much value as fireballers (that's why I look at K/BB and not just K9). Durability is appreciated, but not just for durability's sake. Having said that, a starting pitcher needs 20 starts unless he went 18-1 in his 19 starts, and conversely, I won't bump up a pitcher simply because he has less starts than the opposition. I also don't penalize or split my vote for two pitchers from the same team, but to be the best pitcher in your league, you have to be the best on your team.
And with all that, let's look at the two leagues:
First let's answer the first question by looking at a few league-wide numbers. Note that the names listed below are not the only ones to be considered for the award, but names that appear more than once tend to be the top nominees.
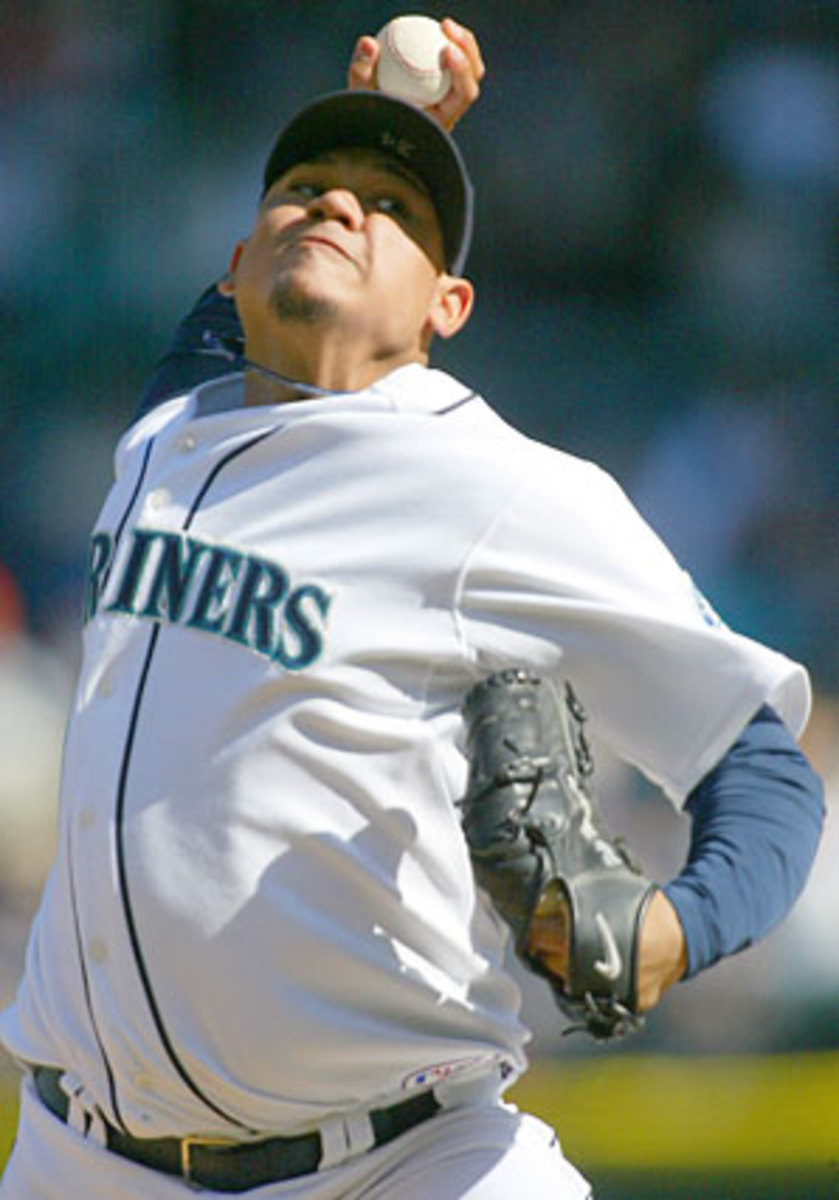
WINS: There were no 20-game winners, but three pitchers recorded 19 wins (Felix Hernandez, Justin Verlander, CC Sabathia).
SAVES: Three closers had more than 40 saves (Brian Fuentes, Joe Nathan, Mariano Rivera).
ERA: Three everyday closers kept their ERAs under 2.00 (Rivera, Jonathan Papelbon, Andrew Bailey), while three starters kept theirs under 3.00 (Zack Greinke, Roy Halladay, Hernandez).
WHIP: Three closers kept their WHIPs under 1.00 (Bailey, Rivera, Nathan), while four starters kept theirs at 1.15 or below (Greinke, Halladay, Hernandez, Sabathia)
K/9: Two closers had a K9 over 10.50 (Joakim Soria, Nathan), while three starters had a K9 of 9.50 or better (Verlander, Jon Lester, Greinke)
K/BB: Two relievers and three starters had a K/BB above 4.00 (Rivera, Halladay, Greinke, Soria, Verlander).
How do I look at these numbers? With wins, for example, I won't just hand the award to one of the 19-win pitchers, but seeing what the ceiling was in the AL this season, I would be hard-pressed to consider someone with less than 15 wins. In other words, leading in a particular category doesn't end the discussion, but it does create a range of where to look for candidates.
In terms of starters, the discussion includes Greinke (on list above 4 times), Hernandez (3), Verlander (3), Sabathia (2) and Halladay (3). The ones that were close but didn't make the cut were Josh Beckett, Joe Saunders and Jeff Weaver. Jarrod Washburn probably contends if he doesn't change teams. Pitchers like Cliff Lee that change leagues but have good years for both are unfortunate, but there's no way to bend the rules for them. And finally, let's add Scott Feldman and Scott Baker to see if they were worthy.
As for closers, it's Nathan (3) and Rivera (4). Soria was close, but I'm less likely to show sympathy for a guy with a closer with a lower save count for a bad team than a starter with a lower win count for a bad team because saves are less dependent on team strength than wins (see Heath Bell in the NL). Bailey had a great year, but he can battle it out for Rookie of the Year with Rick Porcello. As for middle relievers, the AL King Vulture was Alfredo Aceves with 10 wins for the Yankees. Meh.
So if we look at wins, here's what we have with our list above:
19: Hernandez, Verlander, Sabathia17: Halladay, Feldman16: Greinke15: Baker
Now, let's look at their no decisions and re-adjust their totals by giving them wins when their bullpen blew the save (note, I won't just readjust for simply throwing a quality starts because it's up to the pitcher to pitch to the level of the opponent):
22: Hernandez21: Verlander20: Greinke19: Sabathia, Halladay, Feldman17: Baker
Greinke was the hard-luck pitcher with four wins blown and Sabathia was the spoiled child with none (the Phillies starters are gnashing their teeth at that stat). Okay, so now let's look at the players based on their contributions to their teams. For the starters from that list, here's their percentage of their teams wins and their percentage of their rotations' wins (these are based on actual wins, not wins adjusted for blown saves):
Greinke: 24.6% W(team)/32.7% W (rotation)Halladay: 22.7%/29.3%Hernandez: 22.4%/32.8%Verlander: 22.1%/31.7%Feldman: 19.5%/25.0%Sabathia: 18.4%/30.2%Baker: 17.2%/24.2%
First, since their other numbers are unremarkable, let's take Feldman and Baker off the list. Second, while we had a suspicion Greinke would look good under this analysis, he doesn't look THAT good. In fact, statistically speaking, Hernandez, Verlander, Greinke and Halladay are all in the same boat. At this point, I'm also dropping Sabathia from the list. He salvaged his year after a bad April, but with all the advantages he had, his numbers weren't good enough to be the best.
Now let's do the same type of analysis for their ratios. Below are their ERAs and WHIPs, respectively, as compared to a percentage of their starting rotations' ERAs and WHIPs. Keep in mind the lower the percentage, the better. Note that these percentages will include the pitcher's ratio in the numerator and denominator, but that accounts for having the same defense and bullpen:
Greinke: 45.7% ERA (rotation)/75.4% WHIP (rotation)Halladay: 59.9%/77.9%Hernandez: 64.0%/88.4%Verlander: 79.1%/84.9%
Greinke is in a category by himself. Lastly, let's see how good they were in meaningful games. Below is the winning percentage of the teams they recorded wins against and then their September/October numbers. For winning percentage, it's weighted, so for example, if they beat Oakland twice, then the A's 75-87 record would be included twice. We'll see if the pitcher preyed on weak teams or brought it against tough ones.
Greinke: .482 W (opponent W/L percentage)/3-0, 1.39 ERA in September and OctoberHernandez: .510/6-0, 1.51Verlander: .486/4-2, 3.71Halladay: .526/4-2, 1.47
And now Mr. Verlander gets off the bus. His wins against non-quality teams coupled with a 5.20 ERA against Minnesota mean he didn't get it done. The remaining three finished strong, so it's time to go qualitative in our analysis.
Greinke was so much better than the team he played for, but he had a two-month stretch where his only wins were against Houston and Pittsburgh. Hernandez is the sole reason the Mariners stayed over .500 and he beat every team in the AL except Boston, and that was due to a blown save by Shawn Kelley. Halladay persevered against a tough AL East, beating Boston and New York five times, and beat every AL team except Texas (a loss) and Oakland (never played). However, he had a terrible August against his AL East opponents (2-4, 4.71 ERA).
So where do the closers fit in? Both Nathan and Rivera are their team's MVPs. Nathan had more saves than Rivera, but the latter had better ratios and less blown saves. While Rivera wasn't good enough to be put ahead of Hernandez or Greinke, I would slide him in ahead of Halladay, and then put Nathan after him. So my AL Cy Young vote would look like this: Hernandez, Greinke, Rivera, Halladay, Nathan, Verlander, Sabathia, Feldman, Baker.
I'll use the same analysis for the NL, so I'll give less description and more analysis. Here are the league leaders:
WINS: Also no 20-game winners, but the top three were Adam Wainwright (19), Chris Carpenter (17), and Jorge de la Rosa (16).
SAVES: The top four in saves were Heath Bell (42), Francisco Cordero (39), Ryan Franklin (38) and Brian Wilson (38).
ERA: Two everyday closers kept their ERAs under 2.00 (Trevor Hoffman, Franklin), while the top three starter ERAs were Carpenter (2.24), Tim Lincecum (2.48), Jair Jurrjens (2.60) and Wainwright (2.63).
WHIP: Three closers kept their WHIPs under 1.00 (Hoffman, Huston Street, Jonathan Broxton), while four starters kept theirs at 1.05 or below (Dan Haren, Carpenter, Javier Vazquez, Lincecum)
K/9: Three closers had a K9 over 11.00 (Broxton, Rafael Soriano, Carlos Marmol), while two full-time starters had a K9 over 10.00 (Rich Harden, Lincecum)
K/BB: Two closers and two starters had a K/BB above 5.00 (Chad Qualls, Haren, Vazquez, Street).
The frequency of names is more diffuse than the AL's leaders. The starters we should include are Wainwright (1), Carpenter (3), Lincecum (3), Haren (2), de la Rosa (1), Jurrjens (1) and Vazquez (2). I'll also add in Ubaldo Jimenez, Josh Johnson and Javier Vazquez. On the outside looking in are Derek Lowe, Joel Pineiro, Wandy Rodriguez, Bronson Arroyo and Jason Marquis.
As for closers, let's go Bell and Street. Broxton had a good year for a great team, which means he doesn't make the cut. There was a logjam for NL King Vulture at six wins, so double meh for NL middle relievers.
So looking at wins:
19: Wainwright17: Carpenter16: de la Rosa15: Jimenez, Johnson, Vazquez, Lincecum14: Haren, Jurrjens
I know we're digging deeper than we did in the AL, but bear with me. Now, let's adjust their totals for blown saves:
22: Wainwright20: Vazquez, Carpenter19: Johnson18: Lincecum17: Haren, De la Rosa, Jimenez15: Jurrjens
At this point we're going to cut loose Jurrjens and Haren. Jurrjens was the second best pitcher on his team, which becomes readily apparent when Vazquez's five blown wins are considered. As for Haren, I thought he was the victim of more blown saves, but he simply didn't pitch well in the second half (4.62 ERA, 1.26 WHIP). Johnson was just behind Vazquez with four wins lost by his bullpen (and no telling how many were lost by the Marlins' awful defense). Now let's look at pitcher wins as a percentage of team wins and rotation wins:
Wainwright: 20.9% W (team)/27.5% W(rotation)Carpenter: 18.7%/24.6%Vazquez: 17.4%/23.1%De la Rosa: 17.4%/23.2%Johnson: 17.2%/26.8%Lincecum: 17.0%/23.8%Jimenez: 16.3%/21.7%
Remember that in the AL the percentages of team wins were mostly over 20% and the rotation win percentages were mostly over 30%. That shows the pool of NL starting pitching talent was closer and had less true stars than the AL did. Now let's analyze their ratios with ERA and WHIP percentages based on rotations:
Carpenter: 61.2% ERA (rotation)/78.9% WHIP (rotation)Lincecum: 69.3%/84.0%Johnson: 70.7%/84.1%Wainwright: 71.9%/94.5%Vazquez: 81.5%/81.1%Jimenez: 84.6%/90.4%De la Rosa: 106.8%/101.5%
At this point everyone from Colorado get off the bus. This is your stop. De la Rosa's numbers are embarrassing and Jimenez, while a future stud, still isn't there yet. Vazquez almost dropped off, but those five lost wins that kept him from winning 20 games are enough to let him survive this round.
For our final five, let's look at the weighted opponent records of their wins and how they did in September and October:
Lincecum: .502 W (opponent W/L percentage)/2-3, 3.375 in September and OctoberJohnson: .496/2-1, 4.11Vazquez: .496/4-1, 2.28Carpenter: .481/3-1, 2.41Wainwright: .477/3-1, 3.38 ERA
Again, not too much separation except the Cardinal candidates show they got most of their wins (Wainwright, 10 of 19; Carpenter, 11 of 17) by beating up on the feckless Central teams. Lincecum was well above average, but not the feared starter he was last year. Johnson didn't finish strong, but had five wins against NL playoff teams, like Vazquez and Lincecum. So again, no one really stands out.
In a year, where there's no standout candidate one of two things happens: (1) a reliever sneaks in if there's one that separates himself from the pack, or (2) absent any reason to do otherwise, the frontrunner gets the award. Let's look at the closers to see if there's a reason to go with scenario 1. If not, we'll have to go with scenario 2.
Bell had 42 saves for a team that won 74 games, which is impressive and along the lines of team MVP status. Cordero did almost the same thing for the Reds (39 saves in 78 wins) and Street was one of the reasons for Colorado's turn around. However, while Street was out Franklin Morales did just as well, so not really Cy Young worthy. Franklin stepped into the closer's role and got 38 saves while keeping his ERA under 2.00. All did well, but not well enough to win the Cy Young.
So let's fit all these starters and closers together into one NL Cy Young ballot: Wainwright, Vazquez, Carpenter, Lincecum, Johnson, Bell, Franklin, Jimenez, Cordero, Jurrjens, De la Rosa, Haren.
Not inspired, but then again, neither was NL pitching this year.
Well that's it for the season. As always, thanks go to Sports Illustrated for carrying my column and my editor, who makes me look better than I am. And thanks to every one of you out there that takes time out of your day to read my column. I appreciate it and hope to see you again next year.