A new way of looking at relievers
Least effective intentional walkers in 2008 (bomb reflects multiple runs scoring after the walk):
1. Ron Washington (Texas), 20 out of 44 bombed (45.4%)
2. Eric Wedge (Cleveland), 11 out of 28 bombed (39.2%)
3. Cito Gaston (Toronto), 6 out of 16 bombed (37.5%)
4. Bud Black (San Diego), 17 out of 61 bombed (27.9%)
5. Joe Maddon (Tampa Bay), 8 out of 29 bombed (27.6%)
6. Dave Trembley (Baltimore), 12 out of 44 bombed (27.2%)
7. Bobby Cox (Atlanta), 20 out of 80 bombed (25%)
The best intentional walker? St. Louis' Tony La Russa, of course. Only one out of 21 bombed.
The book will break down other things, like the best base runners:
The 2008 best baserunners, excluding stolen bases:*
This list would measure going the number of extra bases a runner gets going from first to third on a single (average runner makes it 27% of the time) second to home on a single (average runner makes it about 59% of the time), first to home on a double (average runner makes it 43% of the time) and also takes into account the extra bases picked up on wild pitches, passed balls, balks, sac flies:
1. Matt Holliday, +28
(Holliday was 15 for 26 going first to third which is amazingly good, 17 for 24 going second to home, 5 for 6 scoring on a double from first, and he took 23 bases, which is a lot. True, you could argue that Holliday is helped by the immense size of Coors Field, but really the guy's an excellent baserunner).
2. Curtis Granderson, +27
3. Nate McLouth +27
(The Gold Glove was a farce, but he's a really good ballplayer)
4. Kelly Johnson +26
5. Shin-Soo-Choo, +26
Every year, like I say, they add all sorts of fun new statistical additions to the the handbook. This year, they added a section called "21st Century Bullpen" which breaks down relievers and makes the very logical case that in today's baseball, bullpen pitchers probably should be assigned positions since they do such very, very different jobs. We already have closers, and then we have a vague collection of set-up men, lefty-specialists, long-men, guys who you bring in to get double play grounders, bridges and so on. And we try to judge them all, more or less, on the same outdated statistics like ERA and won-loss record, and this is absurd.
Anyway, Bill has some real ideas about fixing that, and you HAVE to buy the book and read all about it. For today, I'm more concerned with something else Bill and the guys did: They took all the closers and broke up their their save opportunities into three simple categories:
1. Easy Save. This is a save when the first batter faced is not the tying or go-ahead run.
2. Tough save: This is a save when the tying or go ahead run is already on base when you take over.
3. Regular save: Everything else. (To see a sample from this season, click here.)
Simple enough. Here's a little info on each type of save.
1. Easy save: This represents more than half -- 58% to be exact -- of all save opportunities. And last year all relievers were successful on 87% of their easy save opportunities. Remember, that's ALL relievers -- not just specified closers. People who you would describe as closers (pitchers who had more than 10 save opportunities last year) were actually successful about 92% of the time -- or to put it in perspective, more often than almost any NBA player make free throws or field goal kickers make 30-yard field goals. A real closer should not blow easy saves.
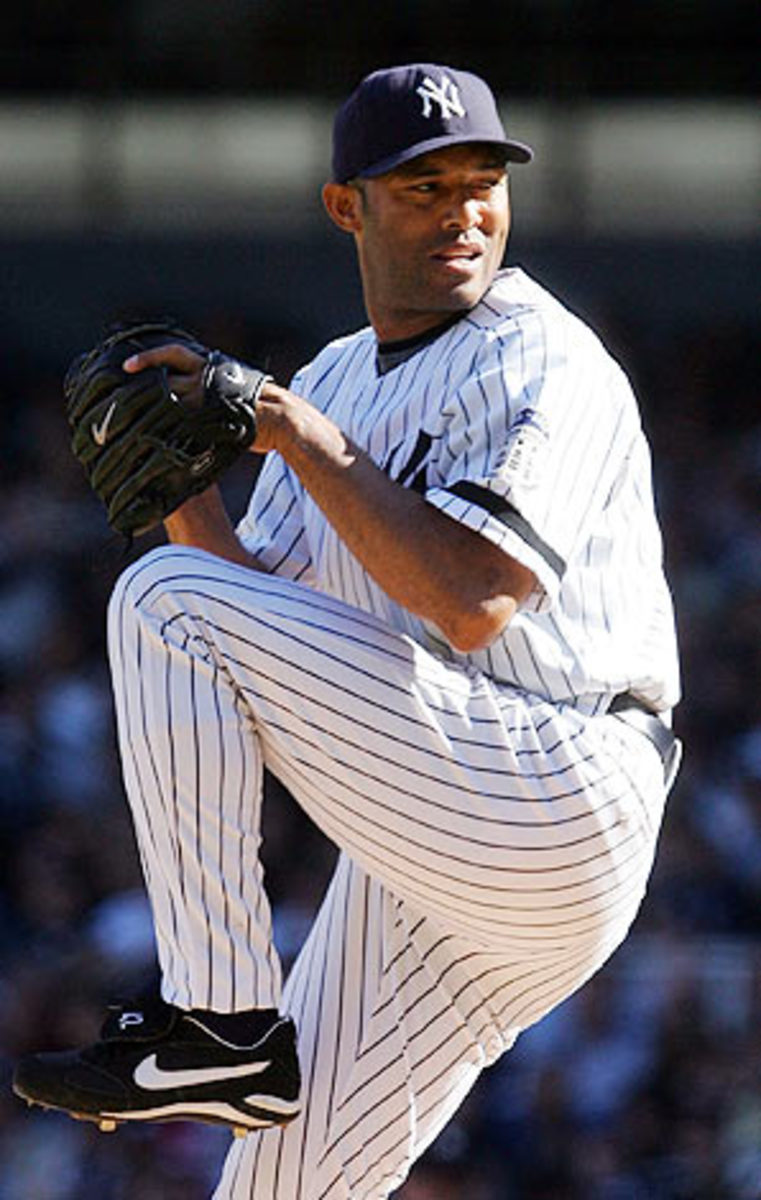
2. Tough save: Almost never happens anymore -- except with Mariano Rivera who was five-for-five in tough save opportunities last year.Most managers bring the closer in to start a clean ninth inning, so tough saves only happen about 5% of the time. And relievers finish them off about 22% of the time. Again, full-time closers do considerably better than that -- they close out about 55% of tough saves.
3. Regular save. Most people would call a regular save a "tough" save because, in most cases it would mean starting the ninth inning with just a one-run lead. Regular saves make up 37% of all save opportunities, and all relievers close them out 57% of the time. Real closers finish them off 72.5% of the time -- as they should since, for the most part, real closers get paid more money.
OK, so this is what we're working with. So, naturally, I had to come up with an utterly meaningless formula to determine who is the best closer because, you know, that's what I do. Using the percentages Bill offered, I figured out how many more (or fewer) saves a closer has than a replacement closer. And then, using my utterly inept math skills, I came up with a CLOSER+ number that attempts to tell you how much better a closer is than average. The average, of course, is 100.
Here goes nothing: these were the best closers in 2008 (20 or more save opportunities):
Expected saves: 27
Actual saves: 39
CLOSER+: 145
I'm was thinking about doing a bigger piece on Rivera I'm fascinated by the guy's ability to get people out for a decade and more with, essentially, one pitch. Plus, I have this theory that I'm working on that Rivera has been even more valuable than his reputation, but for a very odd reason. My thinking is this: Because Rivera has been SO good, there have been very, very, very, very few back pages of the New York Post or New York Daily News that read like this:
Down The River-a: Yankees Blow Game In Ninth
or
BOMBERS BOMBED:Mariano falters late and Pinstripers Lose Again
See, we all know that nothing sucks the life out of a fan base more than the local heroes blowing a late lead. I don't know if it has a measurable effect on the team -- I haven't studied it -- but it definitely seems to have an effect on the general atmosphere, the energy level, the manager's enthusiasm, the talk radio tenor and so on. These things are multiplied in New York. And basically, in the case of Mariano, one guy has more or less eliminated that negativity from the equation.
I don't know ... just something I've been thinking about.
Expected saves: 31
Actual saves: 41
CLOSER+: 132
I got the nicest call from Brad Lidge's grandmother the other day. In this crazy business, you get all sorts of phone calls, from people who hate your guts, to people who love you, to people want something you don't have (like free tickets or time with Tiger Woods). But then you get a nice call from Brad Lidge's grandmother, and it's just, you know, nice.
Expected saves: 31
Actual saves: 41
CLOSER+: 129
The formula goes goes into fractions which is why Papelbon's expected and actual saves are the same as Lidge's but his CLOSER+ is a touch lower. At least I think that's the reason. Papelbon was 4 for 4 in tough saves, which is much better than Lidge (who was not given a tough save opportunity all year). But he was just 15 for 20 on regular saves (while Lidge, of course, did not blow a save opportunity all year long).
Expected saves: 32
Actual saves: 42
CLOSER+: 128
I go back and forth, back and forth, back and forth on whether or not the Royals should try to make Soria a starter. I talk with one person who says they should and that makes sense to me for all the reasons you might expect:
-- A great starter is much more valuable than a great closer.
-- Soria came up as a starter and has multiple pitches and such an easy deliver that he seems a natural.
-- Think about a rotation of Soria, Zack Greinke and Gil Meche -- that's a pretty exciting thing. That, potentially anyway, could be up there with any team in baseball. Throw in a seemingly rejuvenated (or maybe just "juvenated") Kyle Davies, and our beloved Banny (Brian Bannister), and the No. 1 pick of the 2006 draft (Luke Hochevar), I mean, yeah, that would be exciting.
-- If it doesn't work for whatever reason, put him back.
-- I get the sense -- though he's a tough guy to read -- that Soria would like to be a starter.
So, I'm on that bandwagon. Then I talk to someone else who says there's no way the Royals should make him a starter, and I find myself nodding -- that makes too for all the reasons you might expect:
-- Soria is already a dominant closer and there's no telling how he would be as a starter. You don't fool with one of the few things you have done right in a decade.
-- There are very, very, very, very few examples of a guy who begins his career as dominant closer being made into a dominant starter. In fact, when I went back to try and find one, I pretty much rolled snake eyes.
-- If he fails as a starter, you may ruin him as a closer too. You may not, but there's always a risk. Part of Soria's brilliance seems to be that he feels invincible. You would hate to mess with that.
-- There's a great feeling in the clubhouse with Soria closing things out -- everyone knows that if they get to the late innings with a lead they will almost certainly win. You would hate to mess with that either.
-- Who would close? Hochevar? Ram Ram (Ramon Ramirez)? Jeff Montgomery?
Both of these lines of thinking make some sense to me. So, in the end, where do I come down? I would say that at this moment, if I'm playing with someone else's money, yeah, I would at least try to make Soria a starter. I think it would have an excellent chance of working, and I think if it didn't work for some reason I think he would be able to regain his dominance in the pen. Plus ... I'm serious, how can you not get excited about a Soria-Greinke-Meche top three?
Of course, I could be convinced otherwise.
Expected saves: 19
Actual saves: 24
CLOSER+: 126
Expected Saves: 33
Actual saves: 41
CLOSER+: 125
Lyin' in bed just like Brian Wilson did
Well I am ...
Lyin' in bed just like Brian Wilson did
So I'm a-lying here, just staring at the ceiling tiles
and I'm thinking about, oh, what to think about
Just listening and relistening to Smiley Smile
And I'm wondering if this some kind of creative drought
Expected saves: 31
Actual saves: 39
CLOSER+: 124
Expected saves: 24
Actual Saves: 30
CLOSER+: 122
Expected saves: 52
Actual saves: 62
CLOSER+: 119
He had one tough save all year -- which he converted -- and he was slightly better than the average closer on the easy and regular saves. I'm not sure how other relievers would have handled 69 save opportunities from a mental standpoint. And it's significant that he pitched on consecutive days 29 times, more than any other closer. But from a pure pitching quality standpoint, I think there are about probably 10 to 15 other pitchers who, given the same opportunities as K-Rod, would have smashed the save record last year.
Expected saves: 25
Actual saves: 30
CLOSER+: 119
And a quick list of worst closers, 20 or more opportunities:
Expected saves: 16
Actual saves: 15
CLOSER+: 94
The CLOSER+ number is a bit misleading because a 100 closer is actually pretty lousy. The number 100 comes from the average of ALL relievers, not just closers. An average "closer" is actually closer to 115. If that makes any sense at all. Which I'm sure it doesn't.
Other struggling closers in 2008: Billy Wagner (100 CLOSER+), Ryan Franklin (100 CLOSER+) and Jonathan Broxton (103 CLOSER+).


