What is he really worth?: Shin-Soo Choo
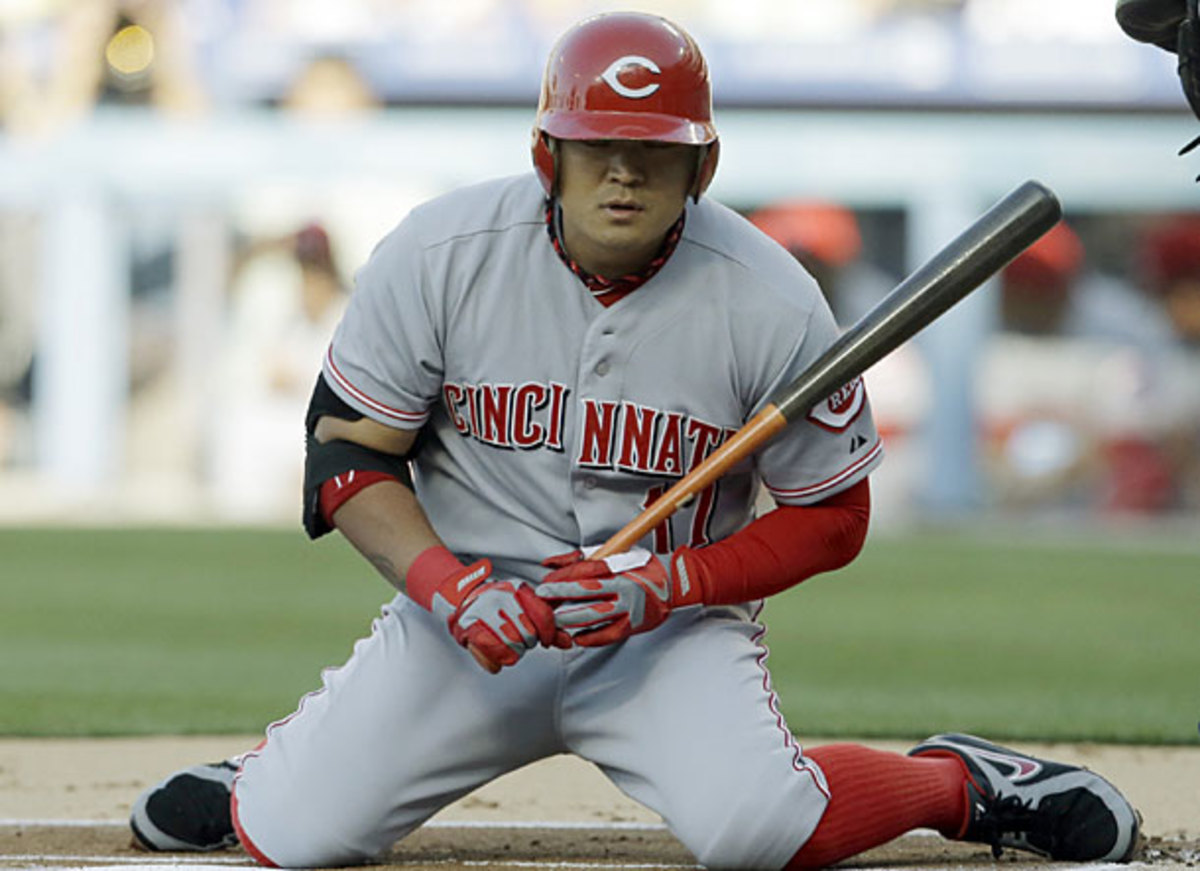
Shin-Soo Choo will have a chance to crack the $100 million barrier. (Reed Saxon/AP)

Over the next few days, SI.com will provide an analysis of some of the top free agents to explore just how much they are really worth on the open market. Next up: Shin-Soo Choo, who's coming off an excellent one-year stay with the Reds.
Having covered Robinson Cano and Jacoby Ellsbury, the top two free agents in The Reiter 50, SI.com's annual rankings of the top 50 free-agents as compiled by staff writer Ben Reiter, we turn our attention to number three on the list, Shin-Soo Choo. The 31-year-old lefty is hitting the market at a very good time, coming off a season in which he set a career high in on-base percentage while reaching the 20 homer/20-steal plateau for the third time in his career.
Before delving deeper into Choo's numbers, here's a quick explanation of what we're trying to determine. This series attempts to grapple with the astronomical price tags attached to this offseason's top free agents, using a simple model that incorporates a player's past performance, a projection of his future performance, the market cost of a marginal win, inflation and aging. It relies on some great research done in those areas. Rather than pin a single value to a player, I am attempting to show how the changes in our assumptions with regard to any of those parameters can affect a player's estimated value, thus producing a range that may or may not be in line with the contract rumors that are floating around.
Traded from the Indians to the Reds in a three-way deal with the Diamondbacks last December, Choo hit .285/.423/.462 with 21 homers and 20 stolen bases in his lone season in Cincinnati. Furthermore, he burnished his credentials as a top-flight leadoff man by posting an OBP 96 points above the major league average for the slot, and seeing more pitches per plate appearance than any NL hitter except Jayson Werth (4.22). Not only did his walk rate spike to a career-best 15.7 percent (up from 11.4 percent prior) en route to the league's second highest total of bases on balls (112), but he was hit by pitches a league-leading 26 times. Early in the year, he was on pace to challenge the modern single-season record of 50, but after 10 HBPs in April and five apiece in May and June, he was plunked just six times the rest of the way.
Even with that outstanding on-base percentage (second in the league only to teammate Joey Votto's .435), Choo was worth only 4.2 Wins Above Replacement (Baseball-Reference.com version) because of his defense. With Ryan Ludwick and Jay Bruce installed in the corners, the Reds stuffed him into centerfield, a position where he had only 10 previous games of major league experience, with just one since 2006, and the results bordered on comical at times. Via Defensive Runs Saved, Choo was 18 runs below average, though other methodologies range from −15.5 (Ultimate Zone Rating) to +13 (Total Zone), with Fielding Runs Above Average (-3.2), Runs Effectively Defended (+2) and Defensive Regression Analysis (+3.2) — the last two of which were incorporated into the Gold Glove voting's sabermetric portion — much more favorable. Roughly speaking, batted ball-based systems hated him, while play-by-play ones (except FRAA) were more generous. His 2012 numbers in rightfield ran the gamut as well, albeit with less consistency with regards to methodology: −16 Total Zone, −12 DRS, −16.7 UZR, −2.3 DRA, +0.2 FRAA. All of this is worth bearing in mind given my reliance upon the DRS-based values used in Baseball-Reference's version of WAR as the input for my model.
Given that Choo's 2010 and '11 defensive numbers show a much narrower spread and a positive bent, it's not unreasonable to assume that his 2012 and '13 values may be underselling him. As such, I think it's appropriate to factor those into our initial baseline expectation. Thus, after inspecting his career Defensive WARs (which factor in his positional adjustments for right- and centerfield), I'm going to apply a modest six-run bonus (0.6 WAR) to the two most recent years. I'm also going to consider four years of data to account for the wild difference between his star-caliber 2010 (6.0 WAR) and his lousy, injury-plagued 2011 (1.6 WAR).
We'll use a 5/4/3/2 weighting system in which a player's WAR for his most recent season is multiplied by five, his WAR from two seasons ago is multiplied by four, his WAR from three seasons ago is multiplied by three and his WAR from four seasons ago is multiplied by two. Those numbers are then added up and divided by 14 (5+4+3+2).
The resulting math puts Choo's baseline for 2014 — when he'll almost certainly be back in rightfield instead of in center — at 4.1 WAR. That's still just 0.3 higher than a straight four-year average of his actual WAR.
Using my standing initial assumptions for this series -- a starting point of $5.276 million per marginal win, five percent annual inflation and a decay of 0.4 wins per year as a good player ages in his early 30s -- this is what Choo's next seven years could look like in terms of actual value produced (the dollar amounts in the last two columns, for market cost per win and an estimate of the value of his annual production, respectively, are in millions of dollars):
Year | Age | WAR | Market $/W | Prod $ |
2013 | 30 | 4.8 | 5.28 | 25.3 |
2014 | 31 | 4.1 | 5.54 | 22.5 |
2015 | 32 | 3.7 | 5.82 | 21.3 |
2016 | 33 | 3.3 | 6.11 | 19.9 |
2017 | 34 | 2.9 | 6.41 | 18.3 |
2018 | 35 | 2.5 | 6.73 | 16.5 |
2019 | 36 | 2.1 | 7.07 | 14.5 |
2020 | 37 | 1.7 | 7.42 | 12.3 |
Over seven years, that's a total value of 20.0 WAR and $125.4 million, numbers right there with my initial estimate for Ellsbury, whose projection looks so similar because they start at the same point (4.1 WAR for 2014) and similar age (Ellsbury is 15 months younger). As with Ellsbury, those numbers are in the same general ballpark of the seven-year deals for Matt Holliday ($120 million through 2016, covering ages 30-36), Werth ($126 million through 2017, covering ages 32-38) and Carl Crawford ($142 million through 2017, covering ages 29-35).
You can be forgiven for having sticker shock, but particularly with the increased television revenue flowing into the game still driving salaries upward, such numbers are a reality. Particularly so for Scott Boras clients; there's a reason Choo and Ellsbury are with the same überagent that netted Holliday and Werth those big deals and are connected in rumors regarding price tag.
Now for the tweaks. Suppose I retreat and ditch those fielding adjustments to Choo's 2012 and '13 WAR. That knocks him down a peg or two, putting his baseline for 2014 at 3.7, and dropping his values over the seven-year range to 17.3 WAR and $108 million, still a considerable chunk of change. If I maintain those adjustments but instead reduce his value at a steeper rate of 0.5 WAR per year, his seven-year totals are 17.9 WAR and $110.9 million.
In my previous pieces in this series, I've mostly stuck to that initial dollars per win figure while also mentioning that those values are likely higher for a contender whose playoff chances increase exponentially with each additional win, since reaching the playoffs allows them to tap into an additional revenue stream. Solidresearch on the topic has brought back higher values in the $6-7 million range, though I've resisted using those because they're largely based on FanGraphs' version of WAR, which I prefer less, particularly given the way it handles pitching (driven by FIP instead of actual runs allowed). Even so, those figures are defensible in the context of this discussion, and it's worth seeing where they take us.
If I instead use $6 million per win while going back to the initial estimates (4.1 WAR for 2014 and a decline of 0.4 WAR per year) from the table above, Choo's value for 20.0 WAR over seven years skyrockets to $171.4 million. Even f I ratchet up the decline to 0.5 wins per year, his 17.9 WAR is valued at $126.2 million. If I instead go back to an initial estimate of 3.7 WAR and stick with that $6 million per win figure, the seven-year value for a decline of 0.4 per year is $124.2 million, and for 0.5 per year is $107.9 million. Crank up his decline to 0.7 WAR per year at that cost per win and he's still worth $91.5 million.
In other words, even with some less-than-favorable assumptions, Choo's production could easily be worth well over $100 million over the next seven years. That's not to say that I think a seven-year deal in excess of $100 million is the most likely scenario; the New York Post's Mike Puma reported earlier this month that "Boras is trying to push Choo as a $90 million player." While he didn't specify the length, one can infer that's for a five-year deal, matching the one Hunter Pence signed with the Giants in late September without actually testing the free agent waters.