%20%20--%3E%0A%3Csvg%20version%3D%221.1%22%20id%3D%22Layer_1%22%20xmlns%3D%22http%3A%2F%2Fwww.w3.org%2F2000%2Fsvg%22%20xmlns%3Axlink%3D%22http%3A%2F%2Fwww.w3.org%2F1999%2Fxlink%22%20x%3D%220px%22%20y%3D%220px%22%0A%09%20width%3D%2239px%22%20height%3D%2240px%22%20viewBox%3D%220%200%2039%2040%22%20enable-background%3D%22new%200%200%2039%2040%22%20xml%3Aspace%3D%22preserve%22%3E%0A%3Cpath%20fill%3D%22%23FFFFFF%22%20d%3D%22M38.5%2C7H28.2v26h10.3V7z%22%2F%3E%0A%3Cpath%20fill-rule%3D%22evenodd%22%20clip-rule%3D%22evenodd%22%20fill%3D%22%23FFFFFF%22%20d%3D%22M26.1%2C25.5c0%2C5.8-4.1%2C7.5-12.9%2C7.5C3.9%2C33%2C0%2C31.2%2C0%2C25.2v-1.1h11.6%0A%09v2.4c0%2C0.7%2C0.1%2C1.4%2C1.2%2C1.4c1%2C0%2C1.2-0.4%2C1.2-1.3v-0.9c0-1.6-0.9-1.6-3.5-2.2C2.2%2C21.7%2C0%2C19.7%2C0%2C15.3v-0.9C0%2C9.3%2C5.5%2C7%2C12.9%2C7%0A%09c10.2%2C0%2C12.8%2C2.6%2C12.8%2C7.4v1.8h-11v-2.9c0-0.6-0.4-1.1-1.2-1.1c-0.6%2C0-1.2%2C0.4-1.2%2C1.1v0.9c0%2C1.5%2C0.9%2C2%2C3.3%2C2.5%0A%09c8%2C1.6%2C10.5%2C3.3%2C10.5%2C7.5V25.5z%22%2F%3E%0A%3C%2Fsvg%3E%0A)
The Most Clutch Players in the WNBA This Season
Who has been the most clutch player in the WNBA this season?
Well, how do you even define clutch in the first place? The WNBA designates clutch time as the final five minutes of a game when the score is within five points. That’s not a bad definition: That specific window winnows down games to the most pressure-packed, critical moments that have an outsized impact on the final outcome.
It isn’t perfect, though. The definition identifies when impactful plays are likely to occur but doesn’t measure how much each play actually mattered. A decisive shot, like Sonia Citron’s buzzer-beating turnaround jumper to lift the Mystics to an 86–85 victory over the Tempo, holds the same weight as a layup that pulls the game to within three points with 4:59 left to play.
There’s a better way to measure clutch performance: win probability added (WPA). The first step is to estimate a team’s odds of winning a game at any moment, given who has possession, the current score, how much time remains and other factors. The second step is to quantify how much a player’s action (a shot or turnover, for example) changed those odds. Applied to those late, close-possession scenarios, WPA can identify which players produced the largest swings in their teams’ chances of winning.
That is closer to a more precise definition of what clutch really is. It’s not a novel concept. Mike Beuoy, who runs Inpredictable, has published WPA stats for the NBA since 2013 and for the WNBA since 2016. He uses a version of WPA for his Jerry West Clutch Player of the Year Tracker, which isolates the portion of a play’s win probability impact that exceeds what is typical for that type of action. In other words, a routine basket receives little or no clutch credit, while a shot that dramatically changes the expected outcome of a game receives much more.
This analysis takes a slightly different approach, using a custom win probability model and a simpler method for calculating clutch WPA than Inpredictable’s. Here, “clutch” is defined the same way the WNBA defines clutch, and WPA includes field goals, turnovers, rebounds, assists, steals and blocks. (Read until the end for a few more details on that front.)
By the numbers, these have been the league’s most clutch players through the WNBA All-Star break:
The WNBA’s most clutch players
The table is sorted by Win Probability Added (WPA) per clutch minute.
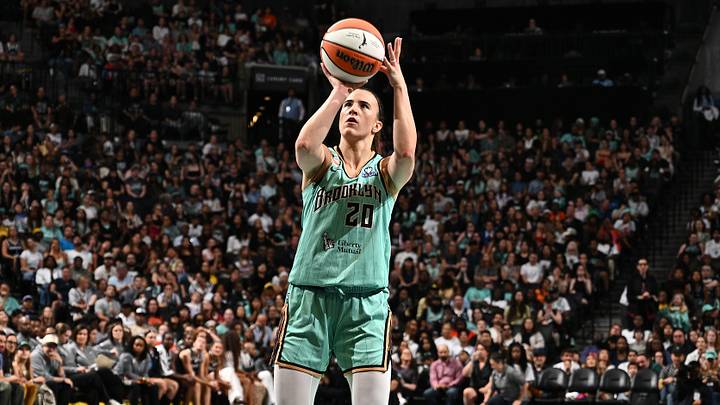
On a per-clutch-minute basis, no player has shifted their team’s expected chances of winning more during the final five minutes of close games than Sabrina Ionescu. She may be the sole reason the Liberty enter the season’s second half at 15–12 rather than below .500, and she’s done it the hard way, at all three levels. Nine of Ionescu’s top 10 clutch plays have come on unassisted makes. She’s converted game-tying and-ones (against the Sky, most recently), as well as overtime go-ahead floaters and threes (against the Wings). Need more evidence, beyond the numbers? Just ask Breanna Stewart. “She literally willed us and carried us at the end,” Stewart said of Ionescu’s performance in New York’s win against Chicago. “She wanted to do anything she could to kind of get the win.”
Doing anything one can to get a win also looks a lot like what Paige Bueckers has done this season. She had a slew of difficult, pivotal makes to both lead the Wings to an overtime win against the Storm on June 22 and secure a close victory over the Sun on July 2. She has contributed 1.29 total WPA on clutch shots, the highest among any player in the league. (Bueckers ranks fourth when giving the shooter full credit, rather than splitting some with the assister, behind Nneka Ogwumike, Sarah Ashlee Barker and Caitlin Clark.) Speaking of Ogwumike, she might’ve hit the clutch shot of the season when she splashed a buzzer-beating three to lift the Sparks to a 98–97 win against the Liberty on June 21.
Clutch WPA need not only come from shots. Only three of Angel Reese’s top 10 most clutch plays have come from makes, and the other seven include moments like her offensive rebound to keep a possession alive and eventual game-sealing block against Emese Hof in the Dream’s opener. It can be derived from assists, too, like when Kelsey Plum drove into the paint, drew three defenders and dished to Erica Wheeler, who proceeded to hit a go-ahead three late in the fourth quarter in a win against the Aces.
What goes into the numbers?
For a moment, try estimating how likely a team is to win a game based on intuition:
- Team A leads Team B, 23–11, with 2:33 left in the first quarter. Team B has possession.
- Team A leads Team B, 60–52, with 2:59 left in the third quarter. Team B has possession.
- The game is tied, 91–91, with 5.5 seconds left in the fourth quarter. Team A has possession.
Most viewers have some instinct for how favorable each scenario is to Team A. You might assign Team A a 65% chance of winning in the first situation, 60% in the second and perhaps 55% in the third. Someone else might choose 75%, 70% and 65%. Those estimates all seem plausible.
Plausible is not enough. For WPA, the estimates need to be well-calibrated. In other words, in-game probabilities should reflect the true level of uncertainty a team faces at any moment. Without that, the change in win probability may reflect a bad initial guess as much as the impact of the play itself.
There are different ways to produce well-calibrated estimates. Beuoy’s Inpredictable fits a statistical model to past games, giving greater weight to situations that most closely resemble the one at hand and using those results to estimate the team’s probability of winning. The model for this analysis maps out the different ways a game could unfold, determines how likely each one is and combines those possibilities to predict each team’s chance of winning at the current moment.
There are objective ways to judge how well a win probability model performs: Do the predictions line up with what actually happened, and is it appropriately confident in those predictions? Tested on 2025 games neither model had seen before, the model used here held a slight edge over Inpredictable’s by two standard measures of prediction quality. On 2026 games, Inpredictable’s model held a slight edge.
With some assurance of reasonable predictions in hand, a second, knotty task is deciding how to credit win probability for different actions. For an unassisted make, it is simple to credit the gain in win probability to the shooter who made the shot. But what’s the right way to assign WPA for more ambiguous actions, like rebounds and assisted makes?
Rebounds have a relatively straightforward answer. Imagine a simple sequence: Down by one with 32 seconds left in the fourth quarter, Dream point guard Jordin Canada misses a shot. At that moment, two things were true. First, the miss has already reduced the shooting team’s win probability. Second, the possession remains unresolved until one team secures the rebound. Rebound WPA can be measured from that post-miss baseline: the rebounder receives credit for the increase in win probability produced by securing the possession rather than allowing the opponent to do so. (As highlighted above, Reese received 12 percentage points of WPA for grabbing the offensive rebound.) Even this approach is imperfect. A rebound credited to one player may have been made possible by a teammate’s box-out, and there’s not enough information to subtract win probability when a player fails to rebound the ball.
Assisted makes are even trickier. Why? Not every assist contributes equally to the make that it produces. Olivia Miles may deserve credit for a make when she drives to the rim, attracts the defense’s attention and dumps the ball off to a wide-open teammate at the rim. She may not deserve as much credit when she makes a routine swing pass to Kayla McBride, who then creates most of the value by hitting a three-pointer.
This problem is as old as public-facing basketball analytics work itself. In the late 1980s, Dean Oliver, the author of Basketball on Paper, watched games and decided that the shooter should get 75% of the credit for long-range shots, 62.5% for medium-distance shots and 50% for shorter, easier shots. (Or, 63% of the credit in general.) The basic idea is that shooters deserve more credit for harder shots.
Without more granular, advanced data, there likely isn’t a precise solution that properly portions the appropriate amount of credit. So, following Oliver’s early idea, a heuristic approach is used here to derive assist WPA.
What we do know is how often shots from different areas of the floor typically go in. Over the past five seasons, WNBA players have shot 62.4% at the rim, 40.0% in the paint, 37.1% from midrange, 37.4% on corner threes and 34.0% on all other threes. Those rates can serve as a rough proxy for shot difficulty. Under this approach, the assister receives credit equal to the historical make rate for that shot location (34.0% on most threes, for example) and the shooter receives the rest. Assister credit is capped at 50%, ensuring the shooter never receives less WPA than the passer.
It’s an imperfect approach. (Does Miles really deserve a third of the credit for this make? Maybe not. It does seem appropriate to give her some credit for an assist like this, though.) A more conservative version includes only actions for which WPA can be assigned more cleanly, like shot attempts, free throws, turnovers, steals, blocks and offensive rebounds. The table below shows the results using that narrower definition.
The table is sorted by Win Probability Added (WPA) per clutch minute for clearly attributable actions.
One final caveat: WPA is not a complete measure of player performance. It does not say how many wins a player was worth. (Meaning, a player with 2.0 clutch WPA did not necessarily add two wins.) It also doesn’t have a concrete, perfect formulation that exactly apportions credit appropriately. What WPA can do, though, is measure the plays that changed the outlook of the game the most when the pressure was the highest—and identify the players who left their mark in those moments.
More WNBA from Sports Illustrated
 Add us as a preferred source on Google
Dan Falkenheim is a fact checker for Sports Illustrated, where he may inundate you with numbers when he writes women's hoops. He joined the SI staff in September 2018 and also produces Faces in the Crowd for print. A graduate of Montclair State, Dan first got hooked on women’s basketball when covering the Red Hawks’ run to the 2015 Division III Final Four for the student newspaper. He lives in New Jersey with his wife and sweet rescue dog, Hari.