How To Talk About Kentucky's Defense
Kentucky's Anthony Davis has been called an "impact defender" so many times that the phrase has lost its impact. He's been called a "game-changer" so often that one can no longer be sure if the Wildcats are playing basketball. Still, the odds of those sayings creeping into NCAA tournament broadcasts are much better than UK's odds of winning the national title -- and it's the overwhelming favorite. For fans who'd like to take the UK-is-good-at-defense discussion a bit deeper, this blog is your three-part guide to impacting a tournament conversation:
I. Anthony Davis Facts
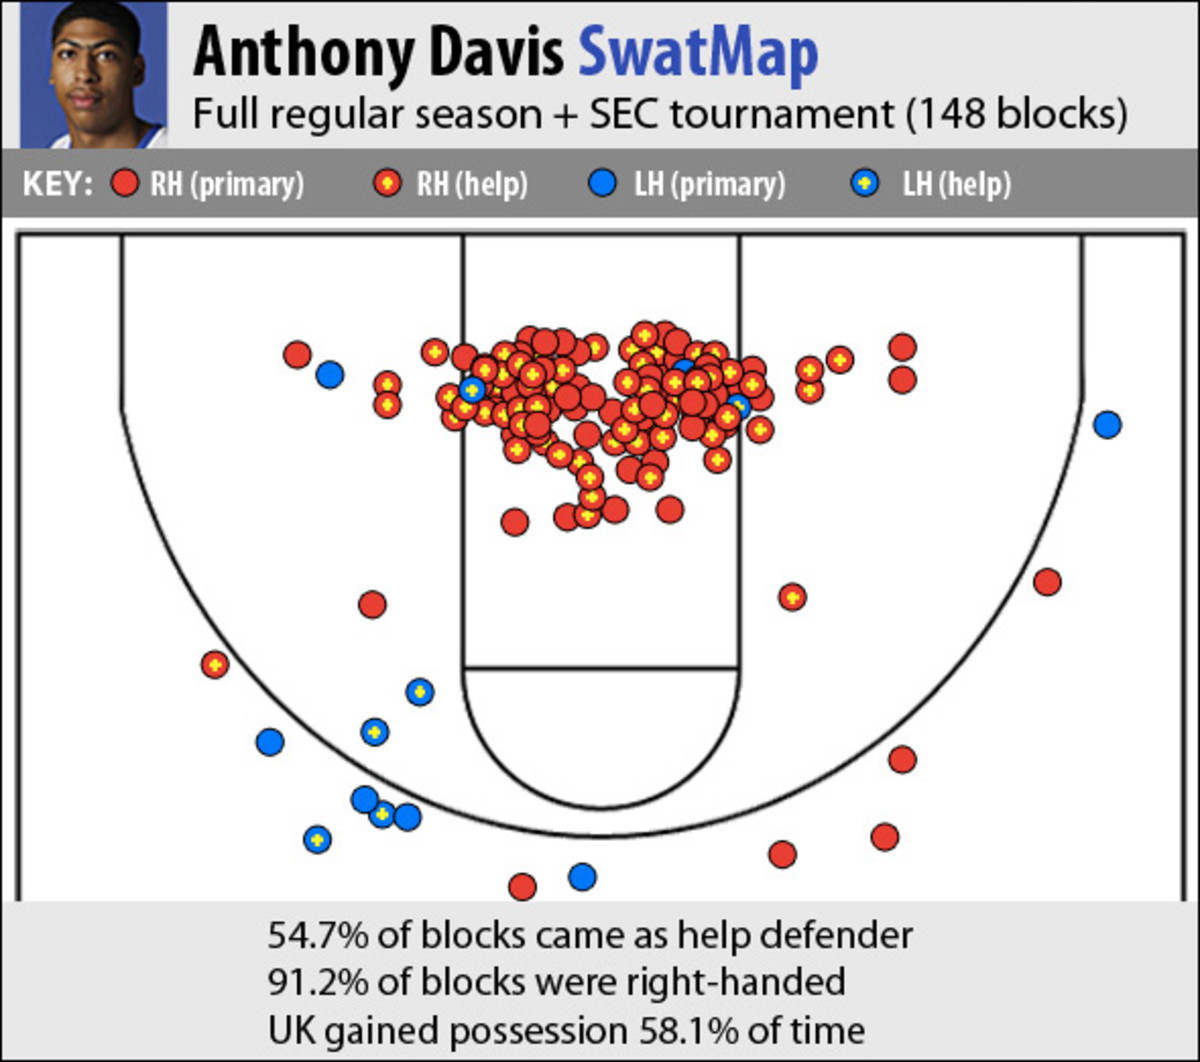
Don't just cite how many blocks Davis has; use our SwatMap (sample: the 148 blocks available in Synergy Sports Technology's database) to know where and how he's been rejecting shots:

Possible conversation-starters:
• Did you know that Davis has blocked 13 threes?
• Did you know that Kentucky retains possession on 58.1 percent of Davis' blocks?*
• Did you know that Davis' mother is 100 percent in support of the Unibrow Party?
(* Not only that, but the trend of the Wildcats keeping possession has been increasing. Of Davis' first 81 blocks -- his season total through Jan. 17 -- 45 were retained, at a rate of 55.5 percent. Of Davis' next 67 blocks, 41 were retained, at a rate of 61.2 percent.)
II. No Easy Shots -- And No Whistles, Either
The discerning fan knows not just that Kentucky excels at D, but also at which components of defense UK excels.
There are four factors that go into a team's defensive profile: its effective field-goal percentage allowed (how well it defends shots), turnover percentage (how frequently it forces turnovers), free-throw rate (how infrequently it sends opponents to the charity stripe) and defensive rebounding percentage (how often it limits second-chance opportunities). A team does not need to be highly ranked in all four categories to have an elite defense, but it needs to excel in at least a two of them.
The first radar plot below compares where the four No. 1 seeds' defenses rank in each of the four factors. The farther out their lines extend the the perimeter, the higher they rank in each category. Keep a printout of the plot in your pocket, because it's sure to be hit in sports bars, where you can take it out and explain that Kentucky excels at challenging shots and not fouling -- and it relies on turnover creation less than any of its fellow No. 1s. That's a good thing.

(Tangential conversational topic suggestion: How crazy does Syracuse's great-at-three-things (especially forcing turnovers), awful-at-one-thing (rebounding) profile look on that radar plot? If the Orange run into a great ball-control team -- like Ohio State, in the Elite Eight -- they could be in for trouble.)
If the discussion turns to the No. 2 seeds that Kentucky might face in its own region, or the Final Four, you'll have a second radar plot handy:

No one here mimics the Wildcat model, but Kansas' narrow diamond is similar to Michigan State's, and Missouri's flattened diamond (skewed toward turnover production and free-throw rate) is a cause for alarm. Ohio State is the best-looking team on either chart, because it's in or near the elites in all four factors. No surprise that the Buckeyes rank No. 1 in the nation in defensive efficiency.
III. Know Where The Other Guys Stand
You can also earn cred by referencing an obscure Kentucky guru: Jonathon Leverenz, the A Sea of Blue contributor who took on the massive project of charting defensive score sheets for every 2011-12 Wildcats game, in the same manner SI did with five teams for its season-preview issue. Leverenz shared his complete, 34-game data* with SI, and it paints a picture of how the other Wildcats fit around Davis to form the country's sixth-ranked defense.
In the table below, DRating is a player's individual defensive rating, or the answer the question, "How many points would the team yield with this player on the floor for 100 possessions?" Small variations in DRating between players are significant, and the ratings should be considered in the context of team's average (89.9). Usage% is the percent of defensive possessions a player directly engages in while on the floor; Stop% is the percentage of those posssessions that end in stops, DeFG% is a player's personal effective field goal percentage allowed, TO% is the percent of the player's defensive possessions that end in turnovers and FTR is the number of free throws created per 100 shots faced.
(* These numbers are unofficial, but Leverenz has a strong grasp on the DSS project, and I wouldn't present the data here if I didn't trust his work.)
Your talking points from that table:
• Davis is the centerpiece, as he has the highest Usage% (26.6), best DRating (86.2) and barely ever fouls (creating just 16.3 free throws per 100 shots faced).
• Fellow freshman Michael Kidd-Gilchrist is a super-valuable auxiliary defender, with a stop percentage (63.2) that actually rivals Davis' (65.4). In this charting system it's diffcult for a wing defender to look as good as an elite, hyper-involved big man, but Kidd-Gilchrist is the Cats' clear second-best asset on defense.
• The oft-maligned Terrence Jones falls into the "Tier 2" category with Kidd-Gilchrist, because Jones puts in work on the defensive glass and forces more turnovers than the two players above him. He doesn't make highlight plays like Davis does, but he's an important complement in the frontcourt.